
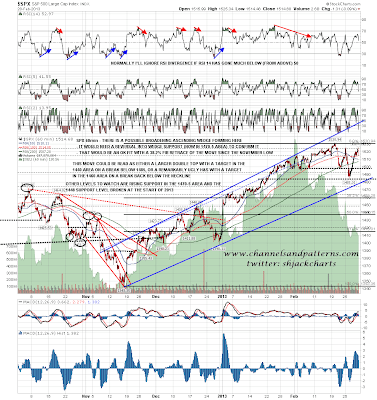
I've noted before that double-tops and bottoms are high probability patterns, and that when they seem to be failing we are often seeing a larger one develop. That may well be what we are seeing here on SPX, and on a clear break below the current low at 1485 that pattern target would now be in the 1440 area. Here's how that looks on the 60min chart:
There was clear negative divergence on the ES 60min RSI at the high yesterday. I've taken a wider view of that today to show the possible broadening ascending wedge forming from the November low and the rising support trendline from the November low that is now in the 1460 area. That is a very significant support level regardless of pattern targets:

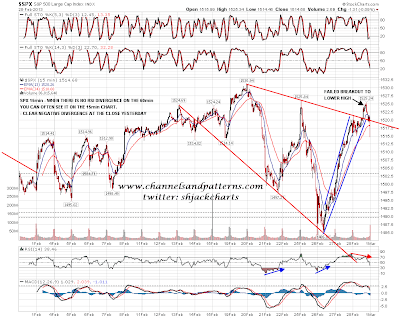
There was also very clear negative divergence on the SPX 15min chart yesterday and while declining resistance was broken, there was no higher high so SPX is still in a technical downtrend making lower highs and lows. To stay in that downtrend it now needs to make a lower low:
If we do see a significant breakdown on SPX here it's worth noting that the last close of 2012 was at 1426.19, and that the weekly middle bollinger band is in the 1450 area. SPX could overshoot that middle bollinger band by 15 or 20 points without necessarily looking lower:

More downside on CL overnight and 92 area support has been broken. A possible falling wedge forming there:

More downside on EURUSD overnight as well. As I capped this chart EURUSD was testing a possible H&S neckline and not far below there is a very significant support area around 1.29:

The budget sequester takes effect tonight and there seems little chance that an agreement will be made before that happens, or indeed in the days shortly afterwards. Obviously this may depress equity markets. On ES and SPX the obvious target is a test of the current retracement lows, with a very significant chance of a break lower.
