
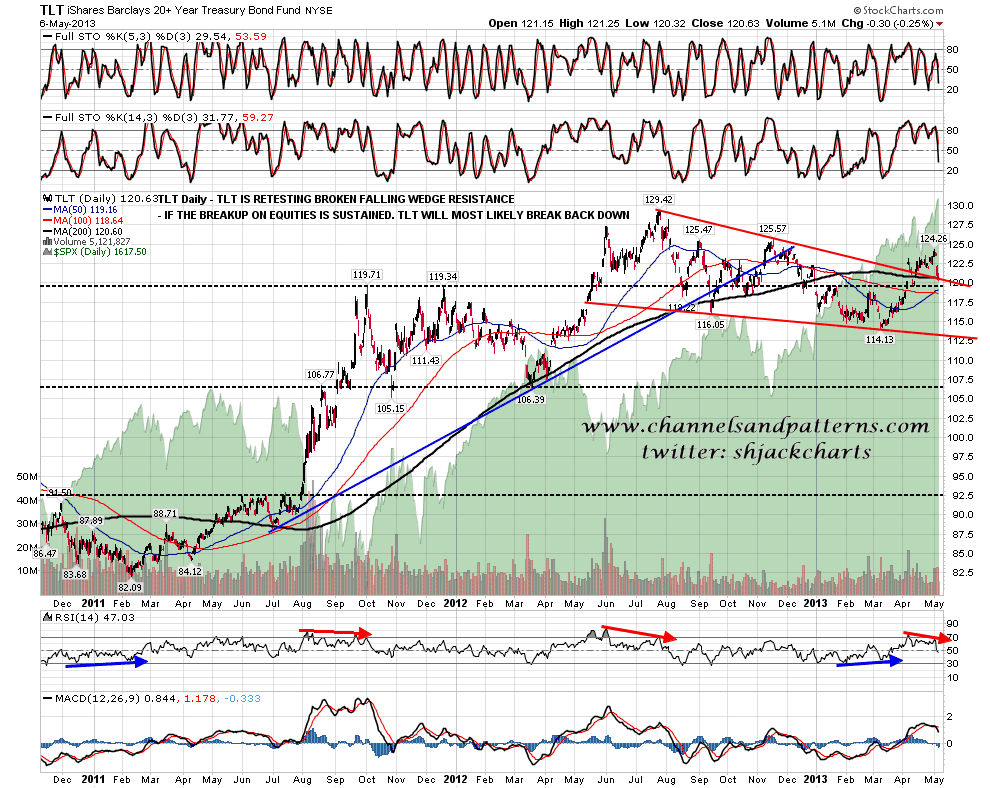
Now that SPX has firmly broken over resistance I have been carefully considering the trendline setup here on SPX. That’s not to say that the short term bear case is entirely dead yet, but it is mostly dead and I won’t be considering it seriously unless we see a very sharp retracement below broken resistance in the very near future. One of the last wisps of hope here for the bear case here is the TLT chart, which still hasn’t yet broken back below broken falling wedge resistance and the 200 DMA in the same area. It’s also worth noting of course that SPX has not yet broken above negative RSI divergence on either of the SPX daily or weekly charts:
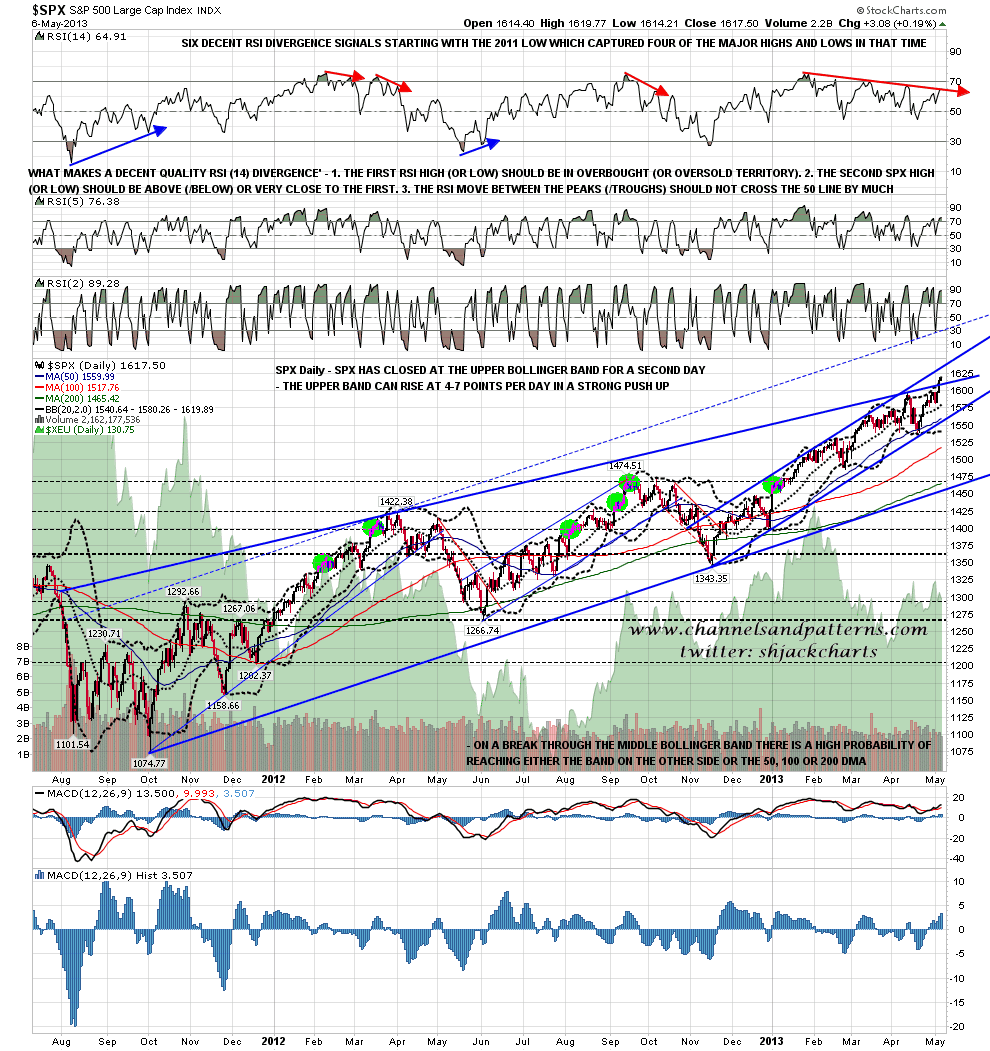
My primary scenario here however, in the wake of last Friday’s decisive resistance break, is that SPX should run up a while from here. As a main upside target I have possible rising channel resistance from the October 2011 low, and that’s in the 1675-1700 area at the moment. Yesterday’s move again closed near the upper bollinger band. That can continue for a few days, and if it does, the upper band can rise at 4-7 points per day in a strong uptrend:
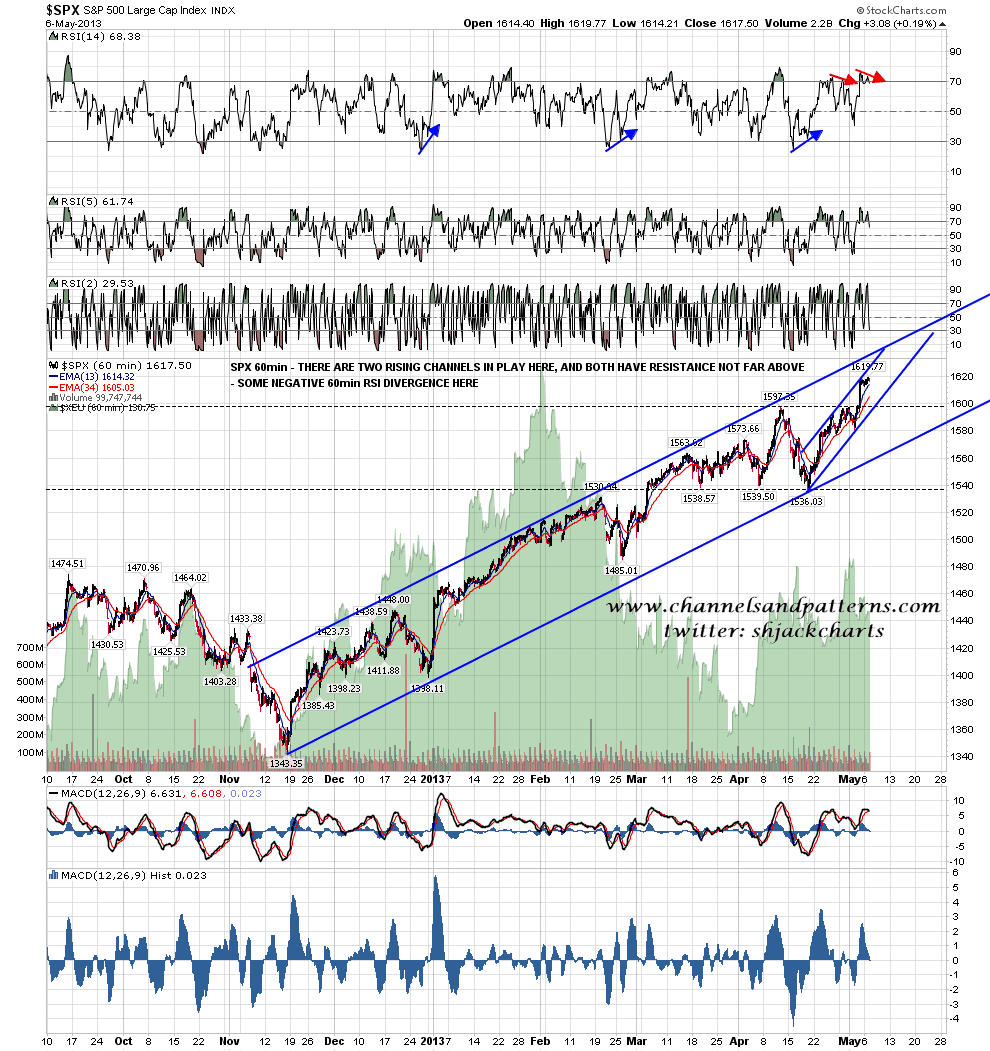
On the SPX 60min chart I mentioned at the 1536 low that rising support from the November low had been hit, and that SPX needed to break back below that soon for any decent retracement to happen. That trendline is now primary trendline support for the move up from the November low, and I have probable channel resistance there in the 1630-5 area. There is some negative RSI divergence at the high yesterday that is worth noting, though the move since Friday’s push up looks like a bull flag consolidation:
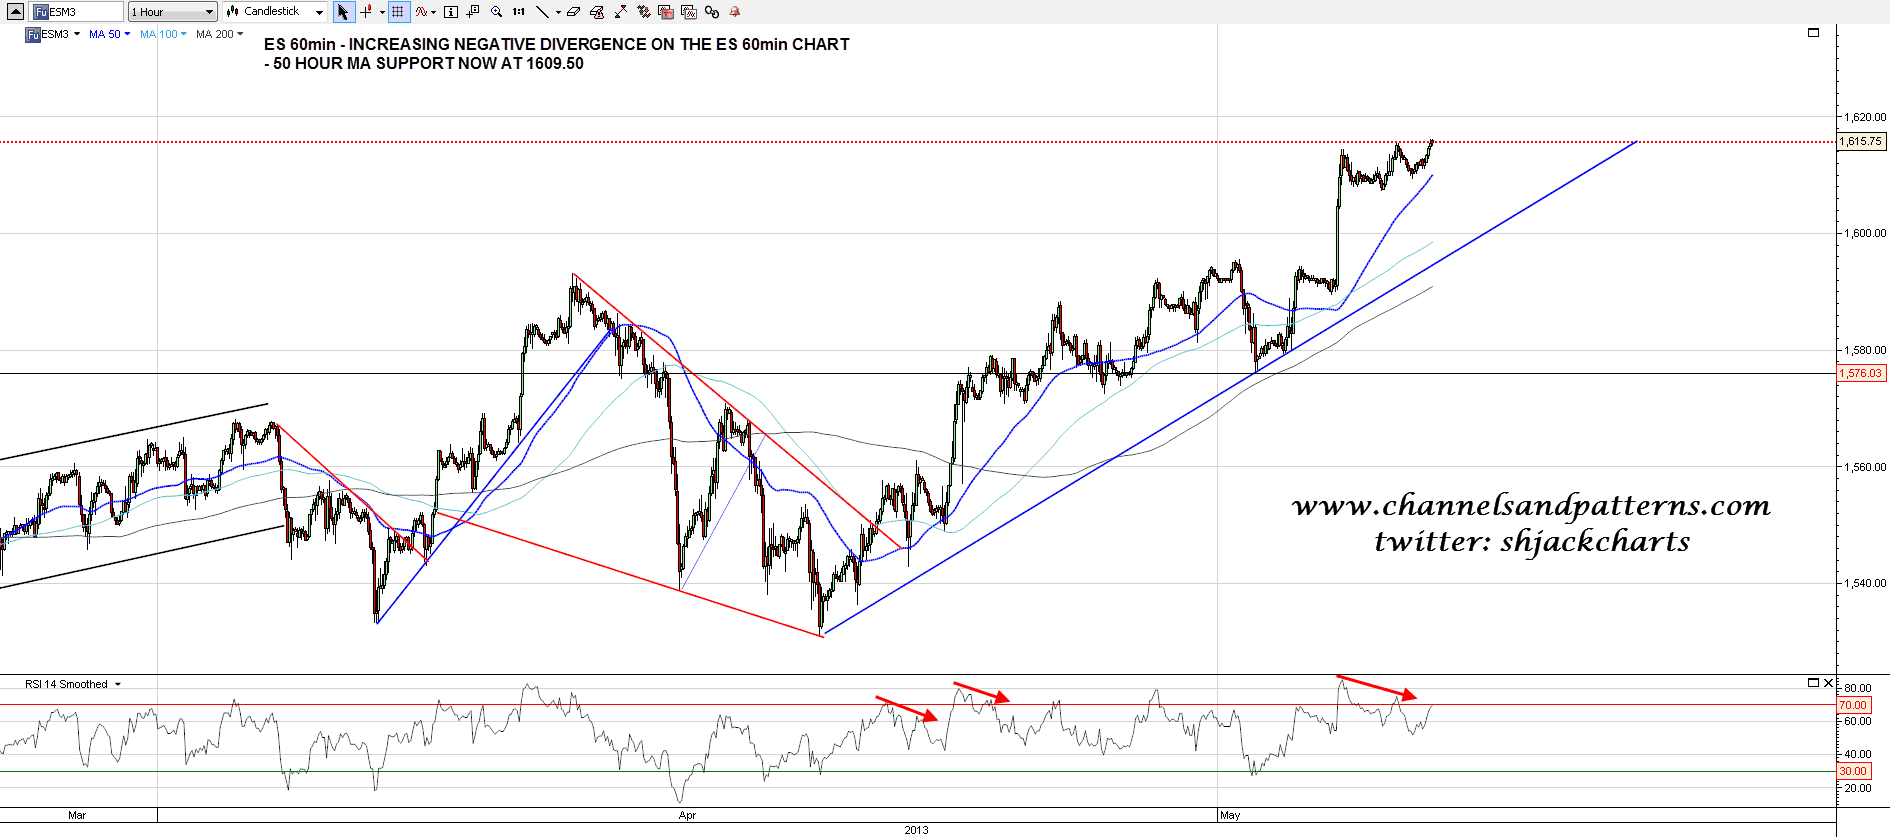
On ES I have rising support from the 1531 low in the 1594 area, and the 50 hour MA is now in the 1609.50 area:
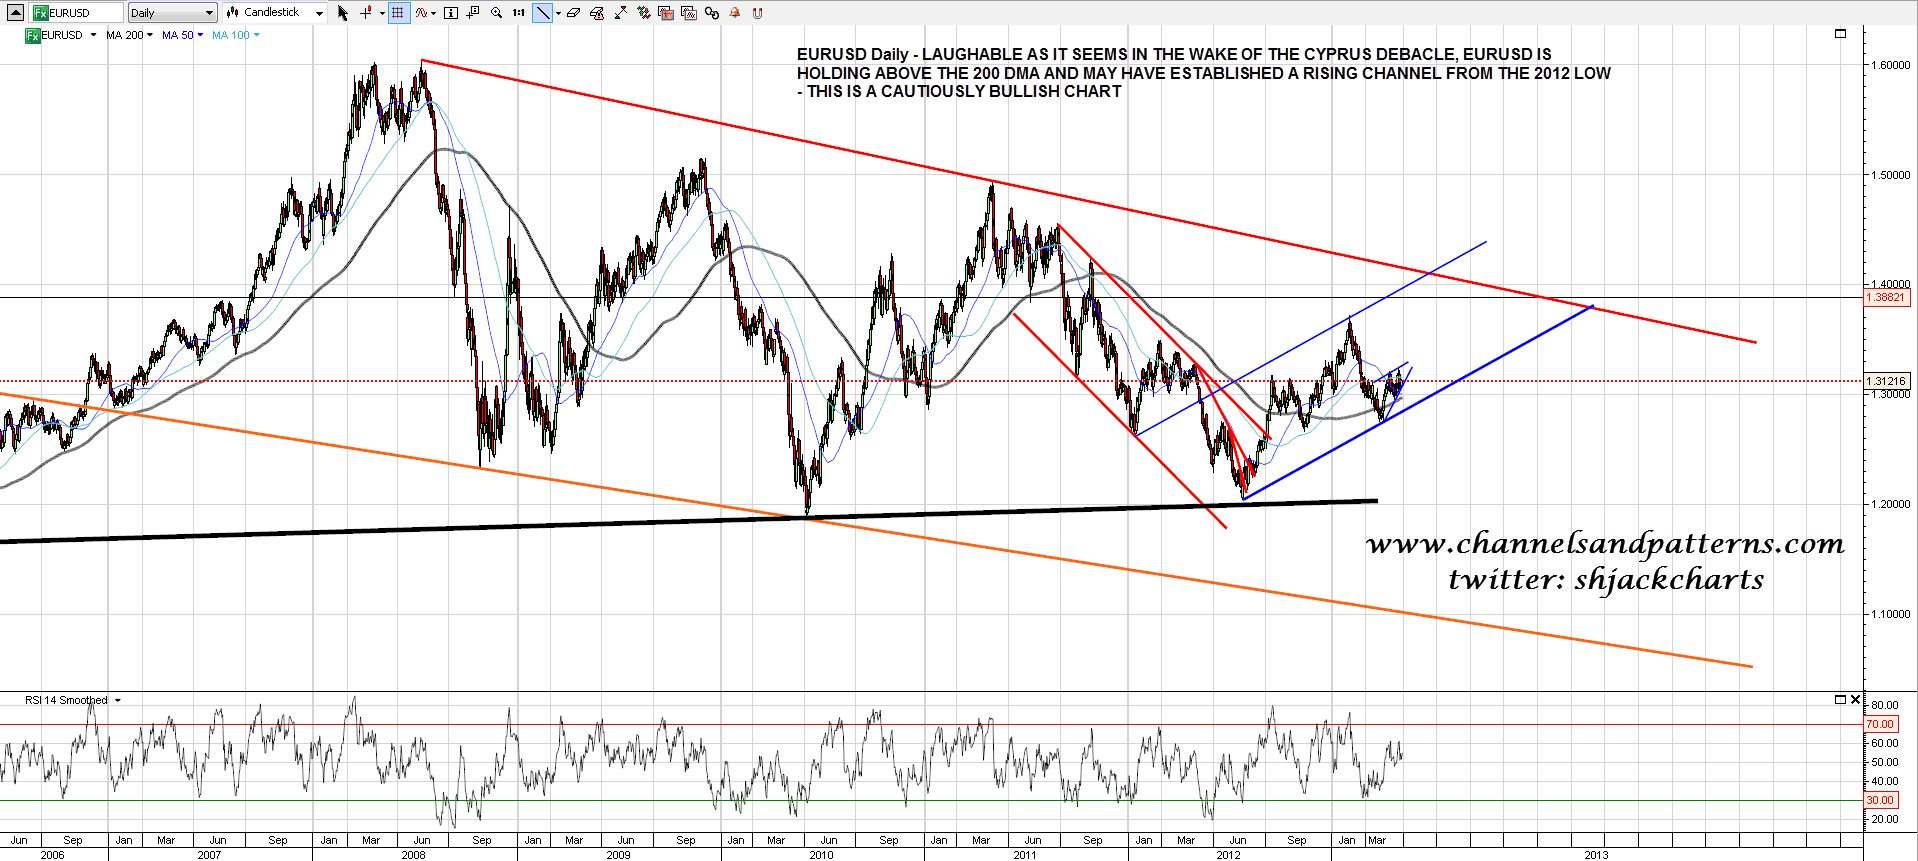
I’ve been having a careful look at EURUSD this morning and the last retracement may have established a rising channel from the 2012 low. EURUSD is also holding above the 200 DMA, and as long as that remain the case this EURUSD daily chart looks cautiously bullish:
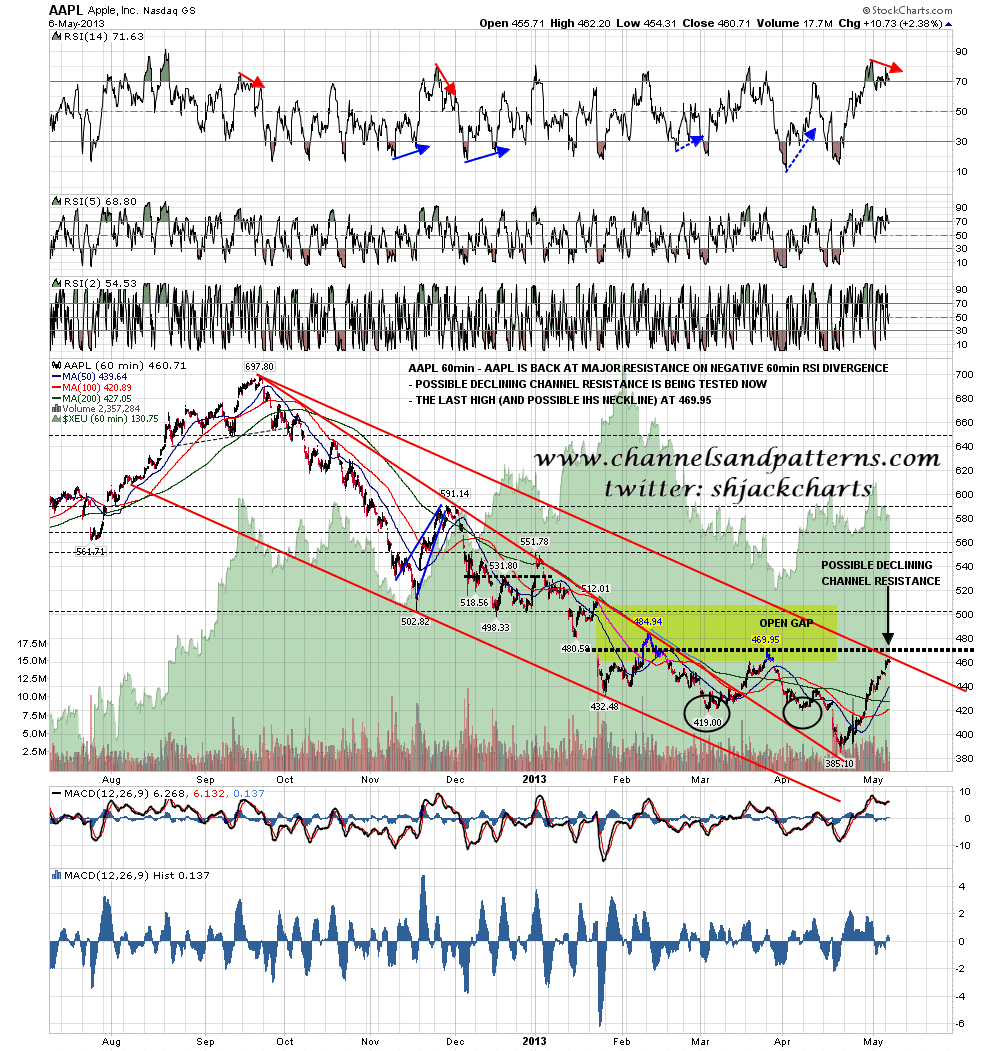
AAPL has had a strong move up from the 385 low, and has now reached an important inflection point at possible falling wedge turns into declining channel resistance. There is definite negative 60min RSI divergence here and at least a retracement looks likely soon. The last short term high was at 469.95 and that is a possible IHS neckline:
I’m leaning towards seeing some retracement today, If the ES 50 hour MA can be convincingly broken I would be looking for a retest of broken resistance in the 1594-1600 area. That would look like an excellent buy the dip opportunity if we see it.
