
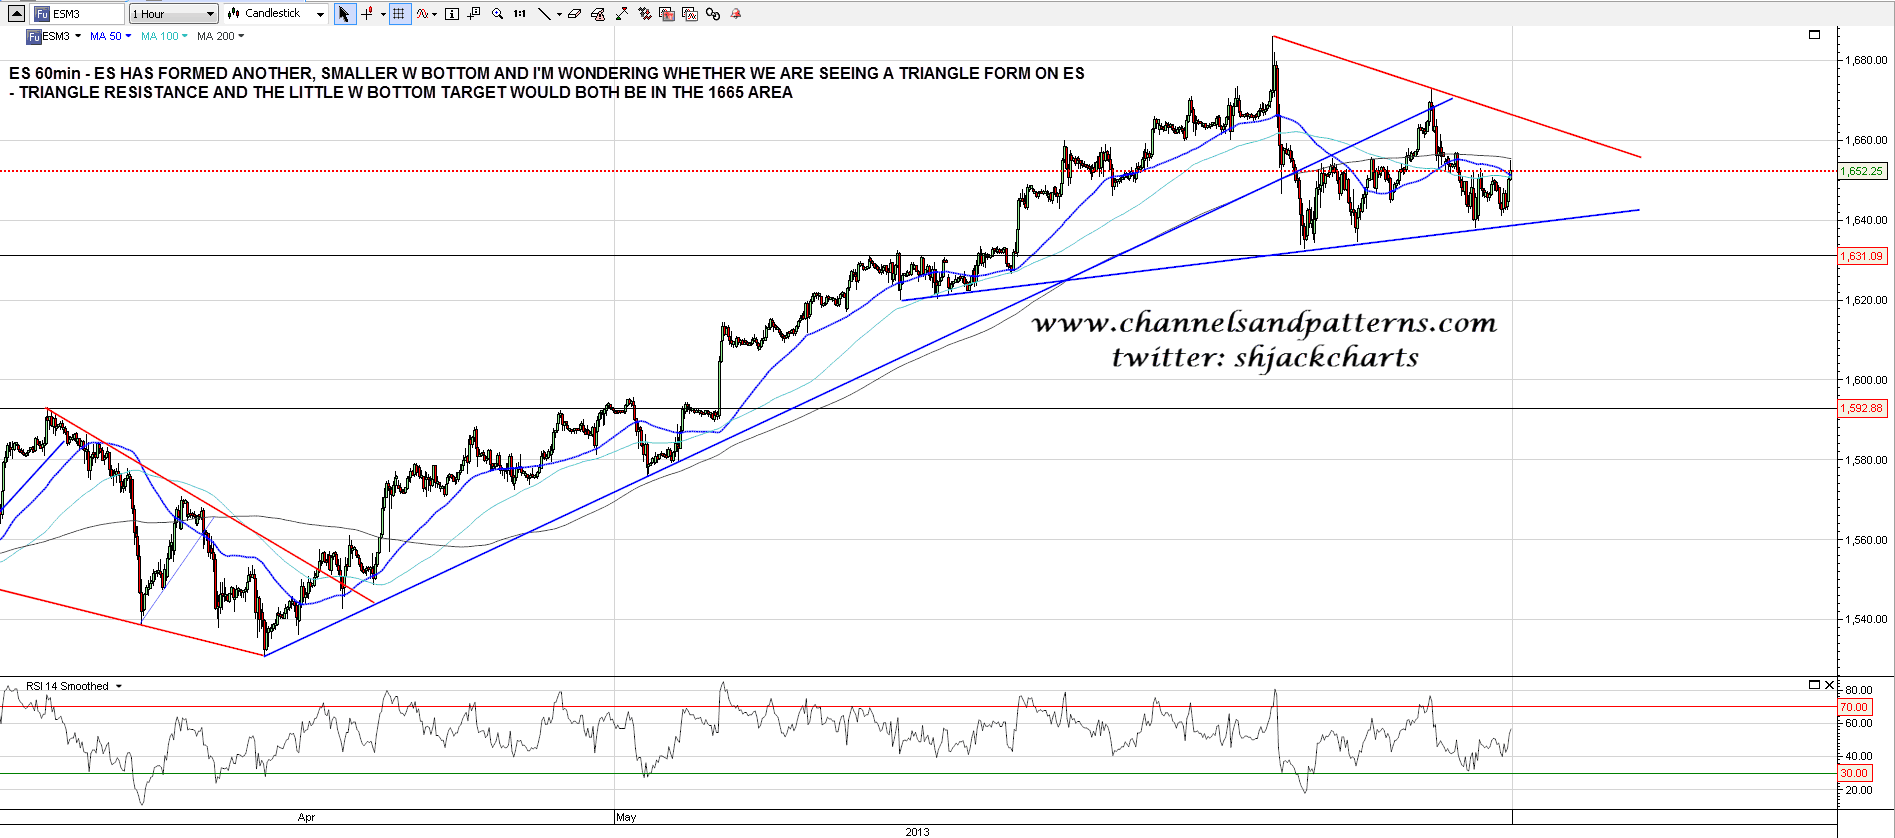
Looking at ES this morning there is an ambiguous looking triangle forming there. A little W bottom has formed at yesterday’s lows, and the target for that pattern, and triangle resistance, are in the 1665 area, so we may well see that level hit today:
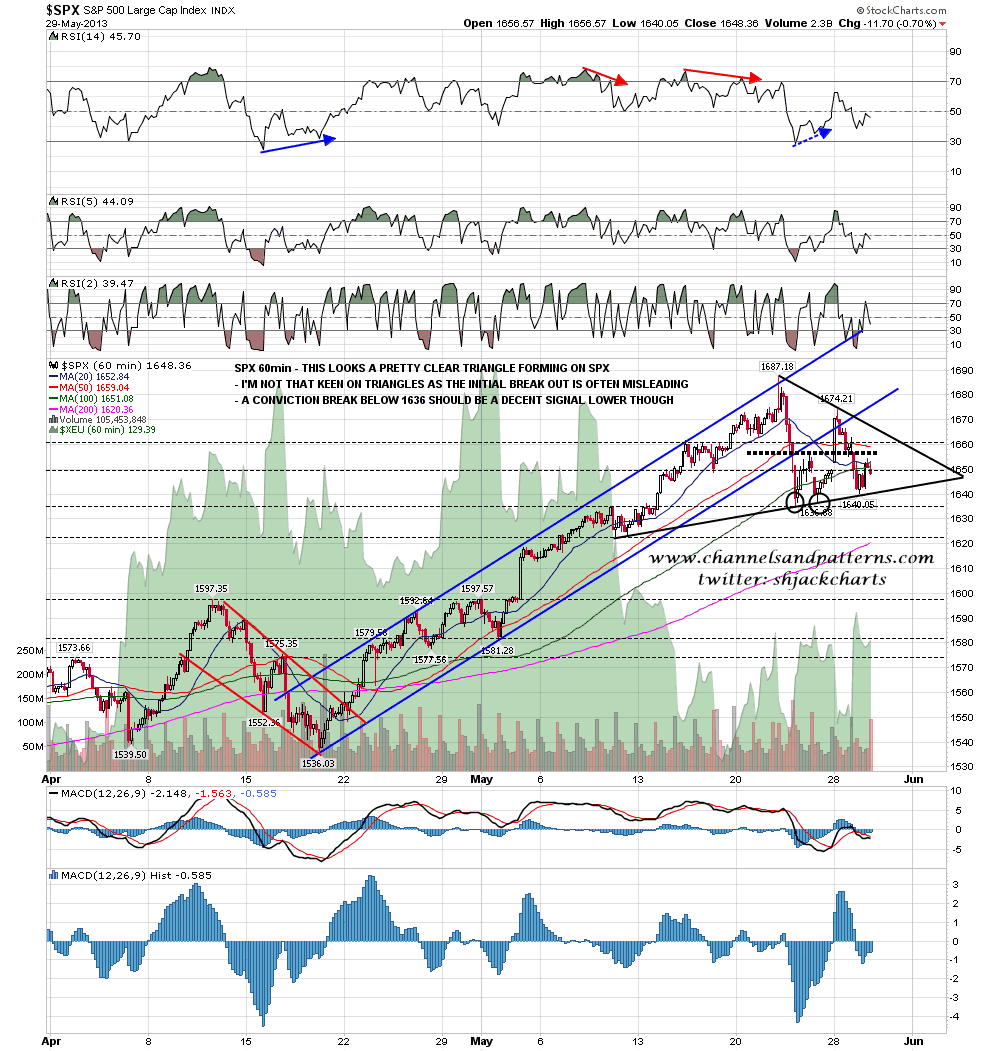
That triangle can also clearly be seen on the SPX 60min chart. I’m not keen on triangles as the first break out of the triangle is often in the wrong direction, but if we see a conviction break below last weeks low at 1636.88 that should still be a reliable signal for a move to test the 1600 area:
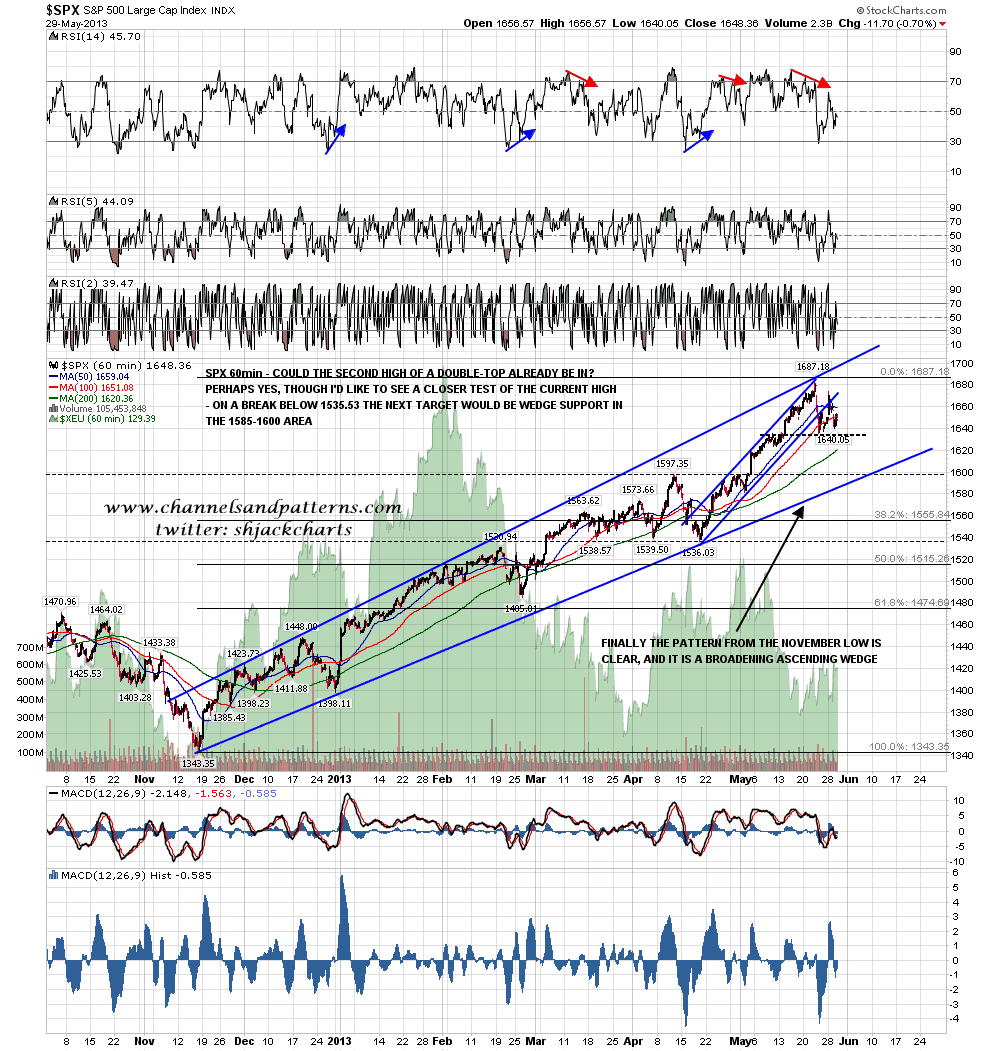
Overall I’m still leaning short on equities here, and the main pattern I’m watching is the broadening ascending wedge on SPX from last November. Before we see the move to test wedge support though, there is still a chance that we will see the current highs tested, and this ES/SPX triangle may be setting up that retest. Here’s the wedge from November and that wedge support trendline is now slightly over 1580:
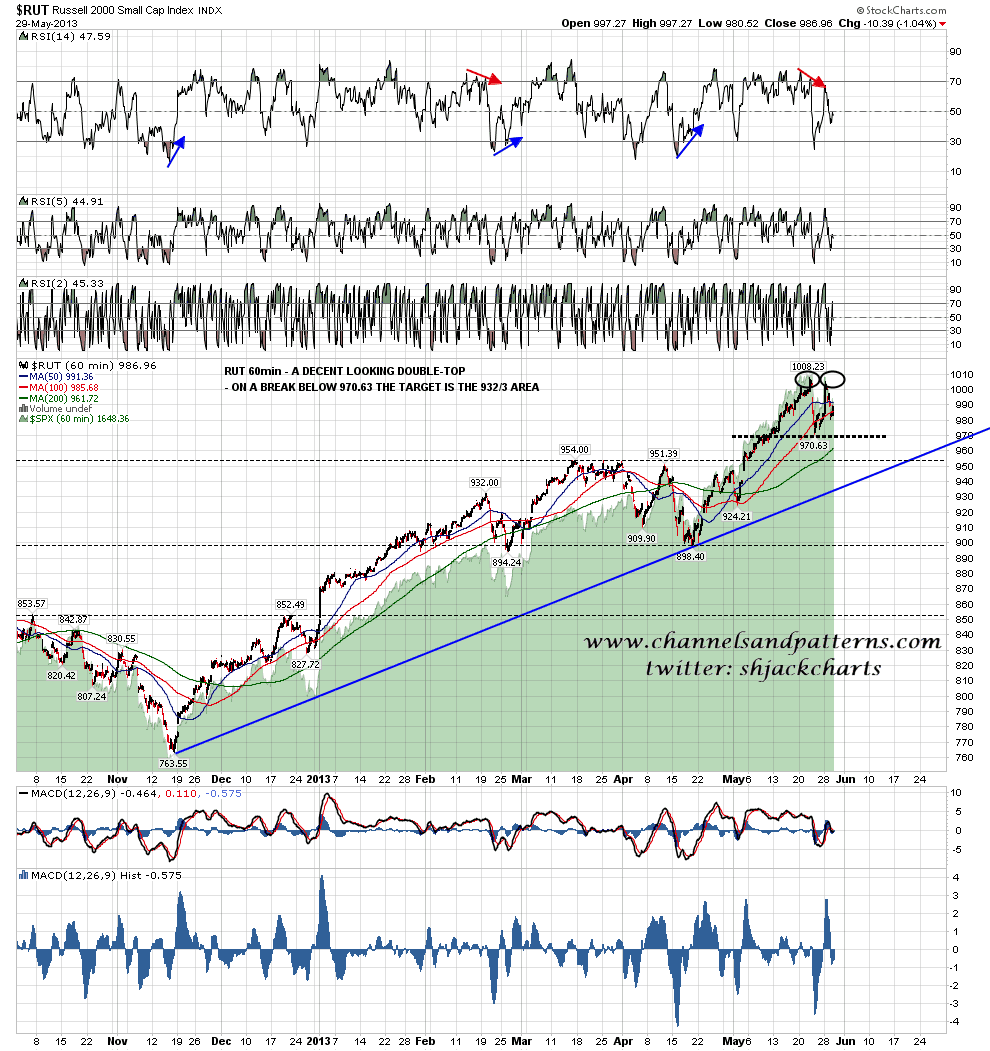
Looking at other indices from November there is a nice looking double-top setup on RUT here:
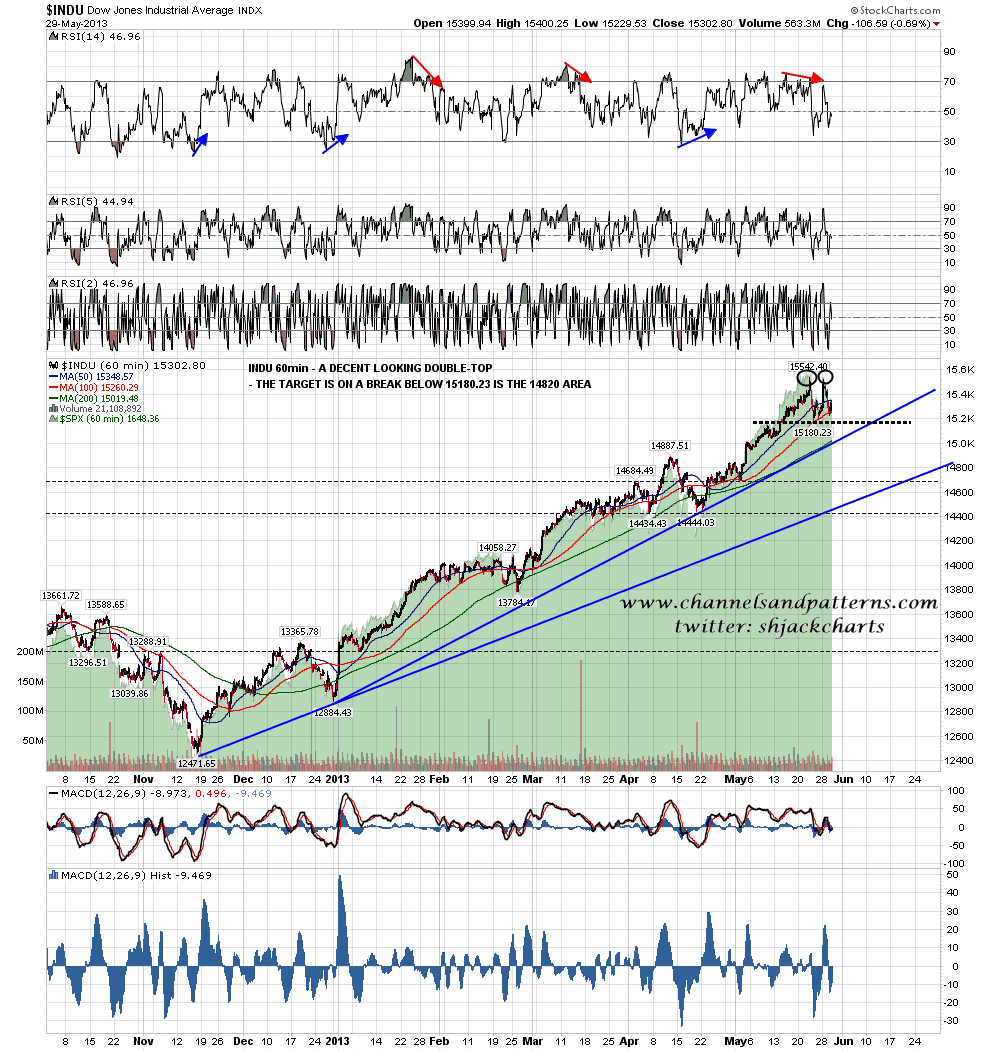
Another nice little double-top setup on Dow here:
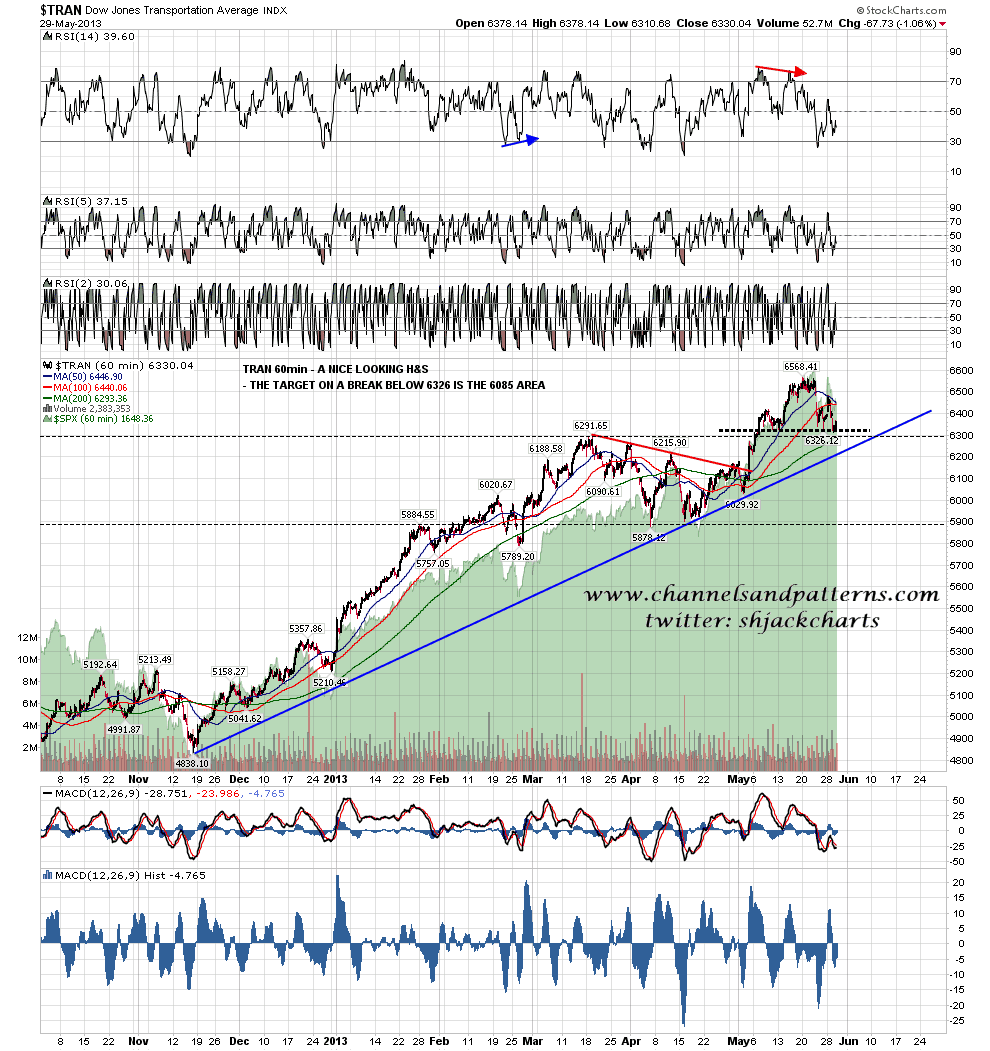
There’s also a nice looking H&S setup on TRAN. None of these individually give us the direction over the next week, but together they do suggest that the current highs on SPX most likely won’t be retested before these patterns play out, and also if these all break down that will be a strong signal that we should then expect to see wedge support on SPX tested soon afterwards:
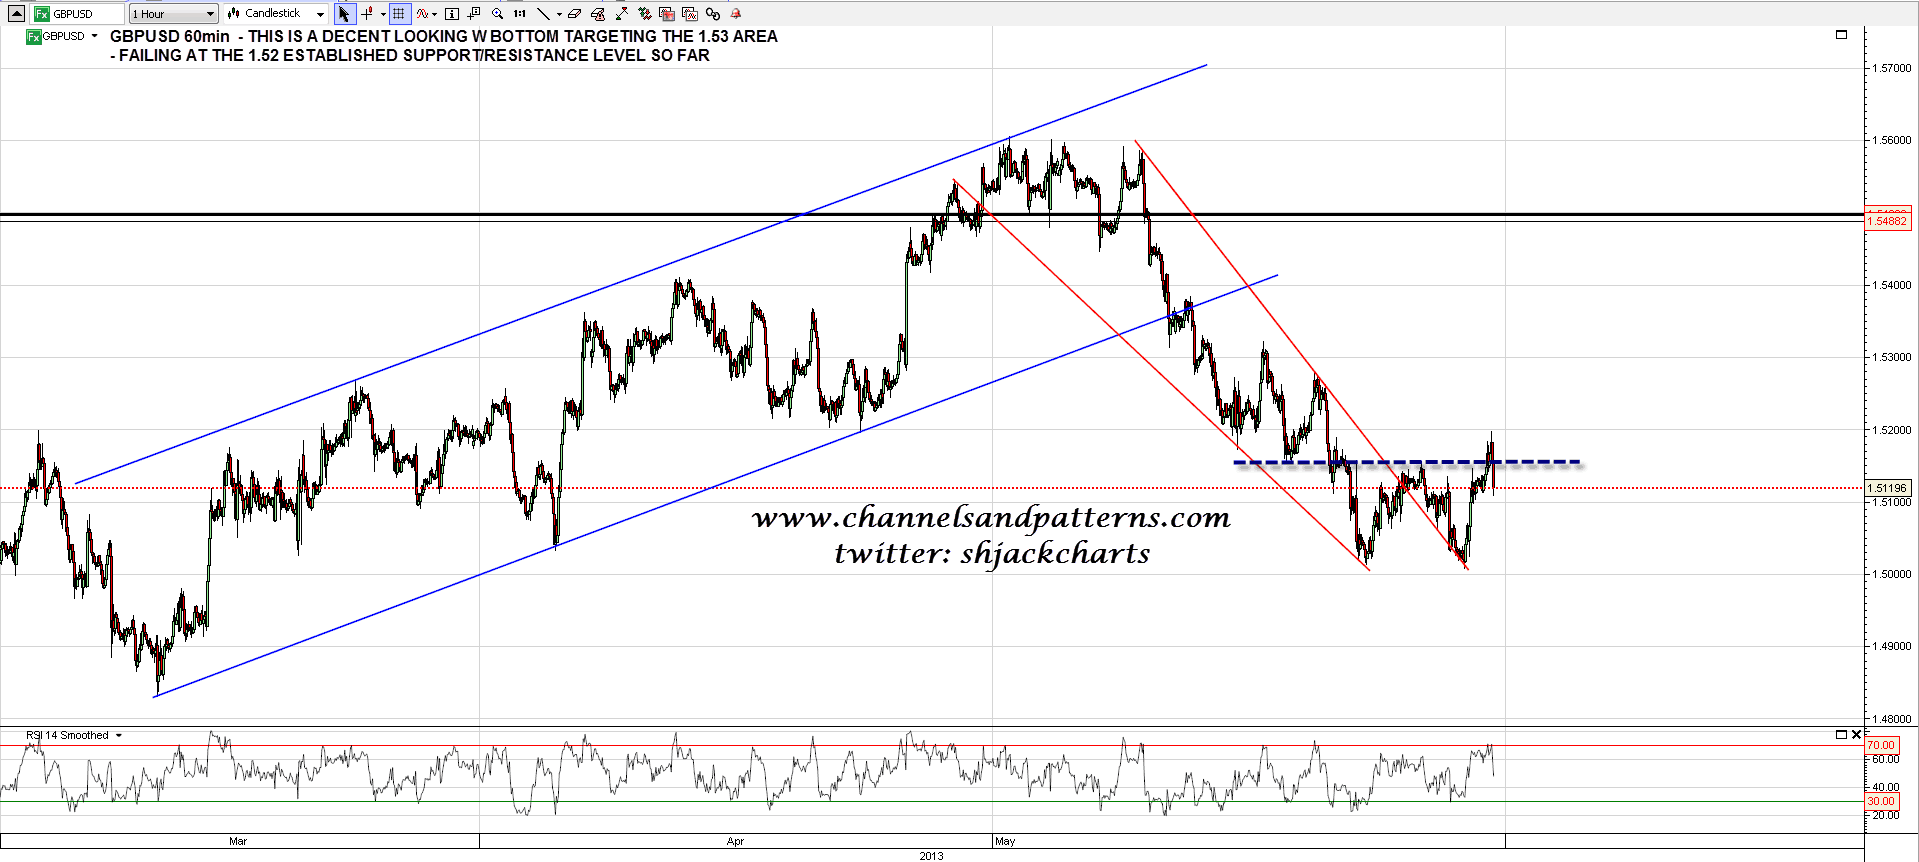
The W bottom on GBPUSD that I’ve been watching form broke up overnight but has been failing at 1.52 so far. The target is the 1.53 area. That should be a decent re-shorting entry I think, though there are quite a few analysts looking for a larger USD reversal than that here:
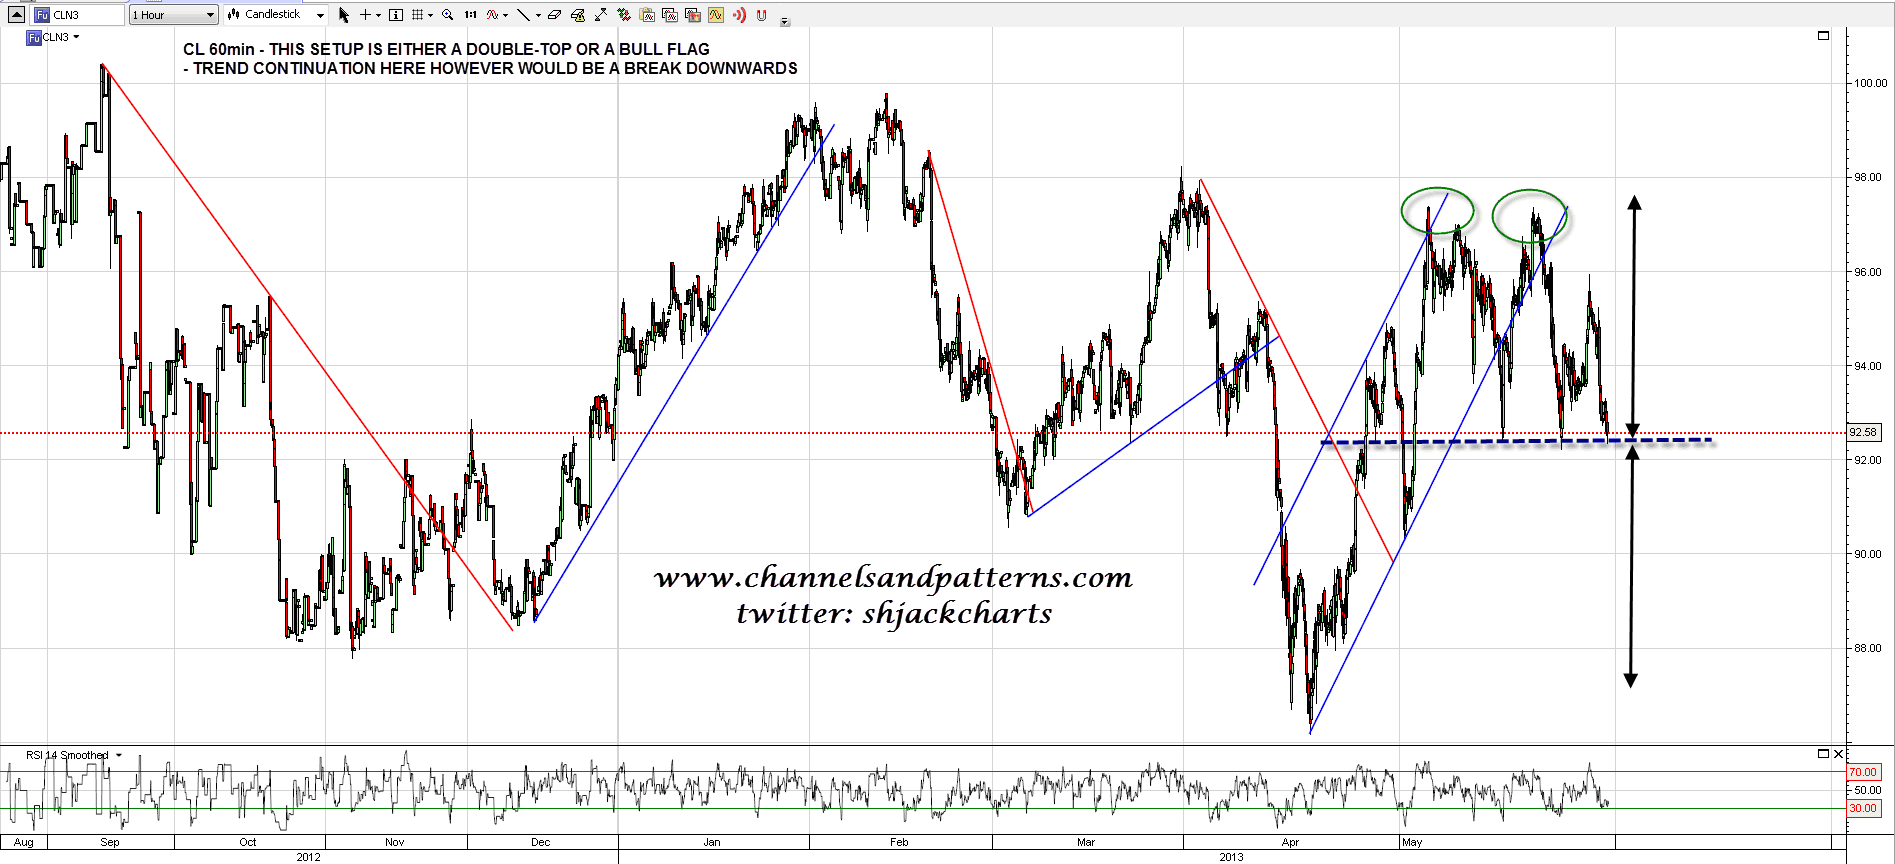
I posted a CL chart on twitter a couple of days ago showing the bull flag and bear double top options there, and CL is testing support again overnight. Trend continuation would be a break downwards here, as CL has been in an overall downtrend over the last few months, but on the other hand CL has been forming a triangle since mid-2010 and the next triangle target is in the 102.5 area. I’m leaning short but this could very much go either way:
The two significant moving averages to watch on ES in recent days have been the 50 hour MA, currently at 1650, and the 200 hour MA, currently at 1655. If ES breaks over 1655 I’ll be looking for a move to triangle resistance in the 1665 area.
