
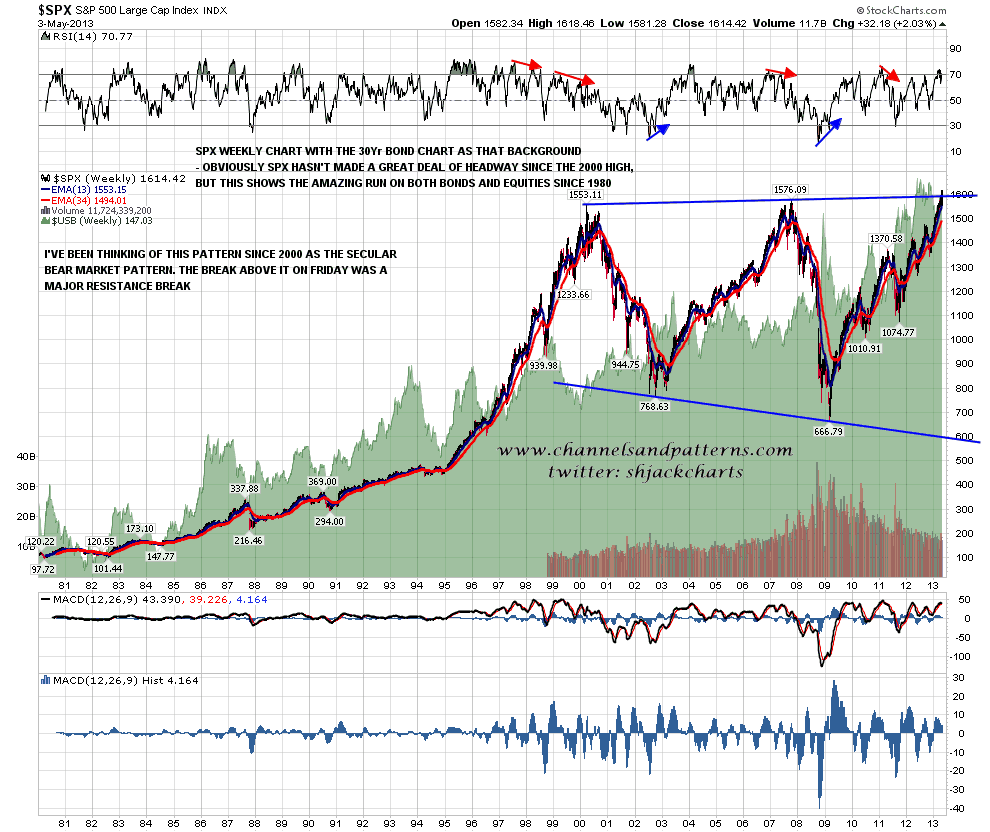
SPX was underneath some formidable trendline resistance on Friday, but broke it all on Friday morning. Most notable of the broken resistance trendlines was the trendline from the 2000 high, as I have been thinking of the pattern since then as the secular bear market pattern. Whether that’s right or not that trendline is now broken:
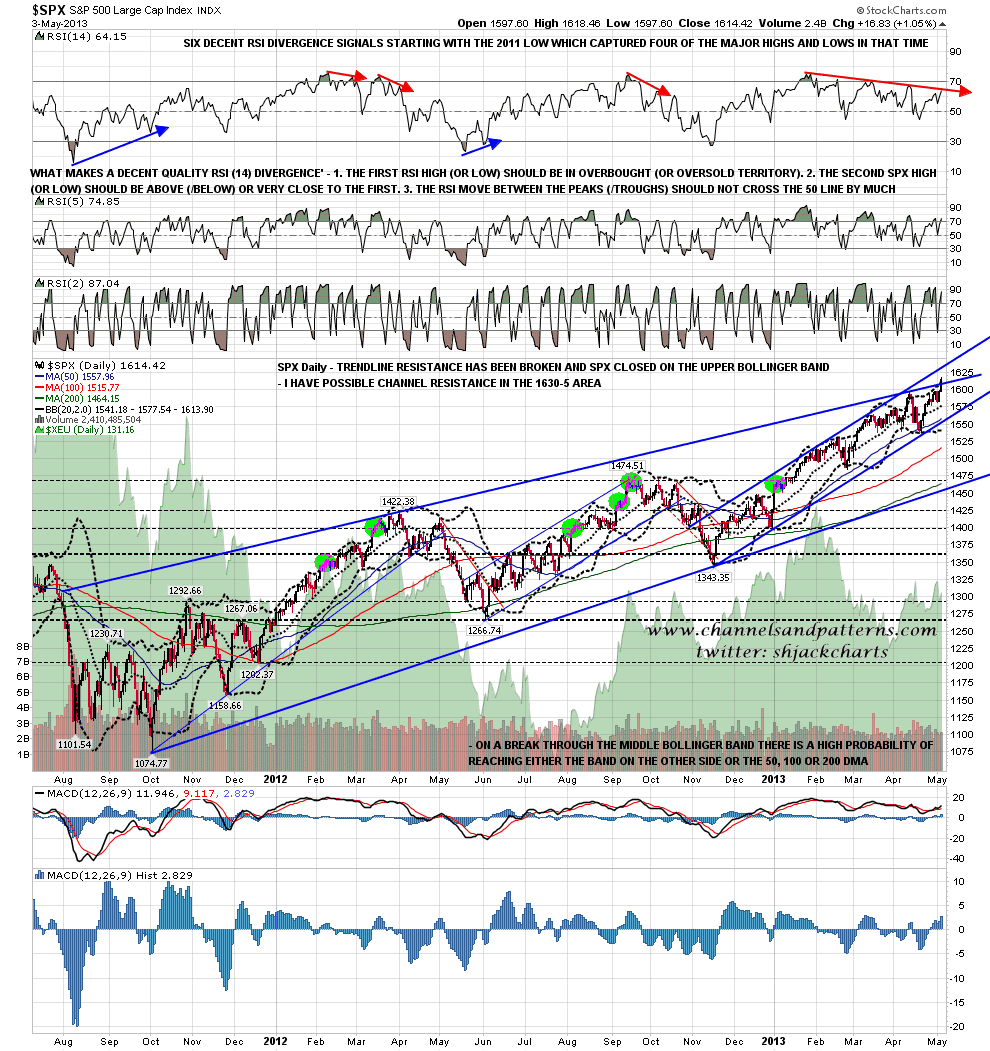
SPX closed at the daily upper bollinger band on Friday. That is decent resistance but can rise by 4 to 6 points per day during a strong push up. Immediate trendline resistance was broken and I’ve marked in a current theoretical channel resistance trendline in the 1630-5 area:
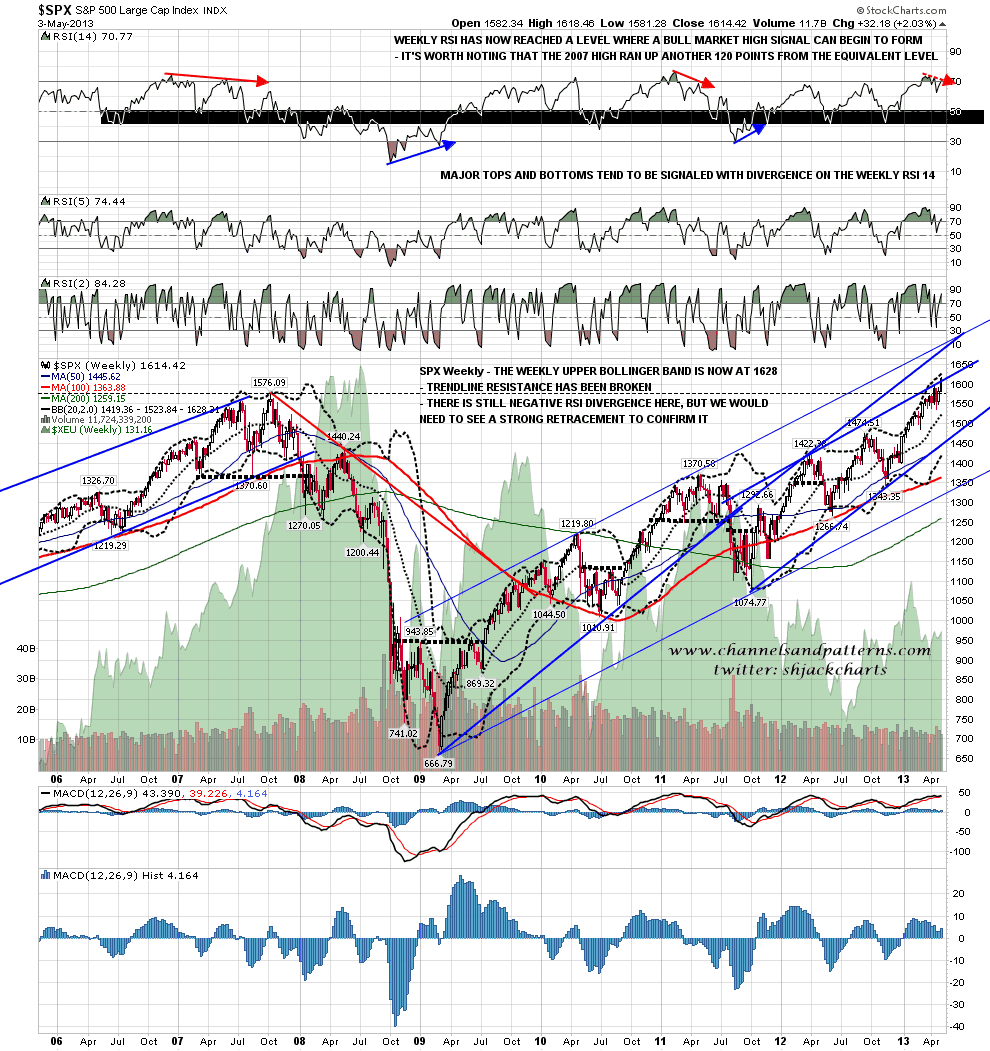
On the SPX weekly chart the next obvious target is the weekly upper bollinger band, and that closed last week at 1628. On this chart the next obvious major trendline resistance is in the 1700 area:
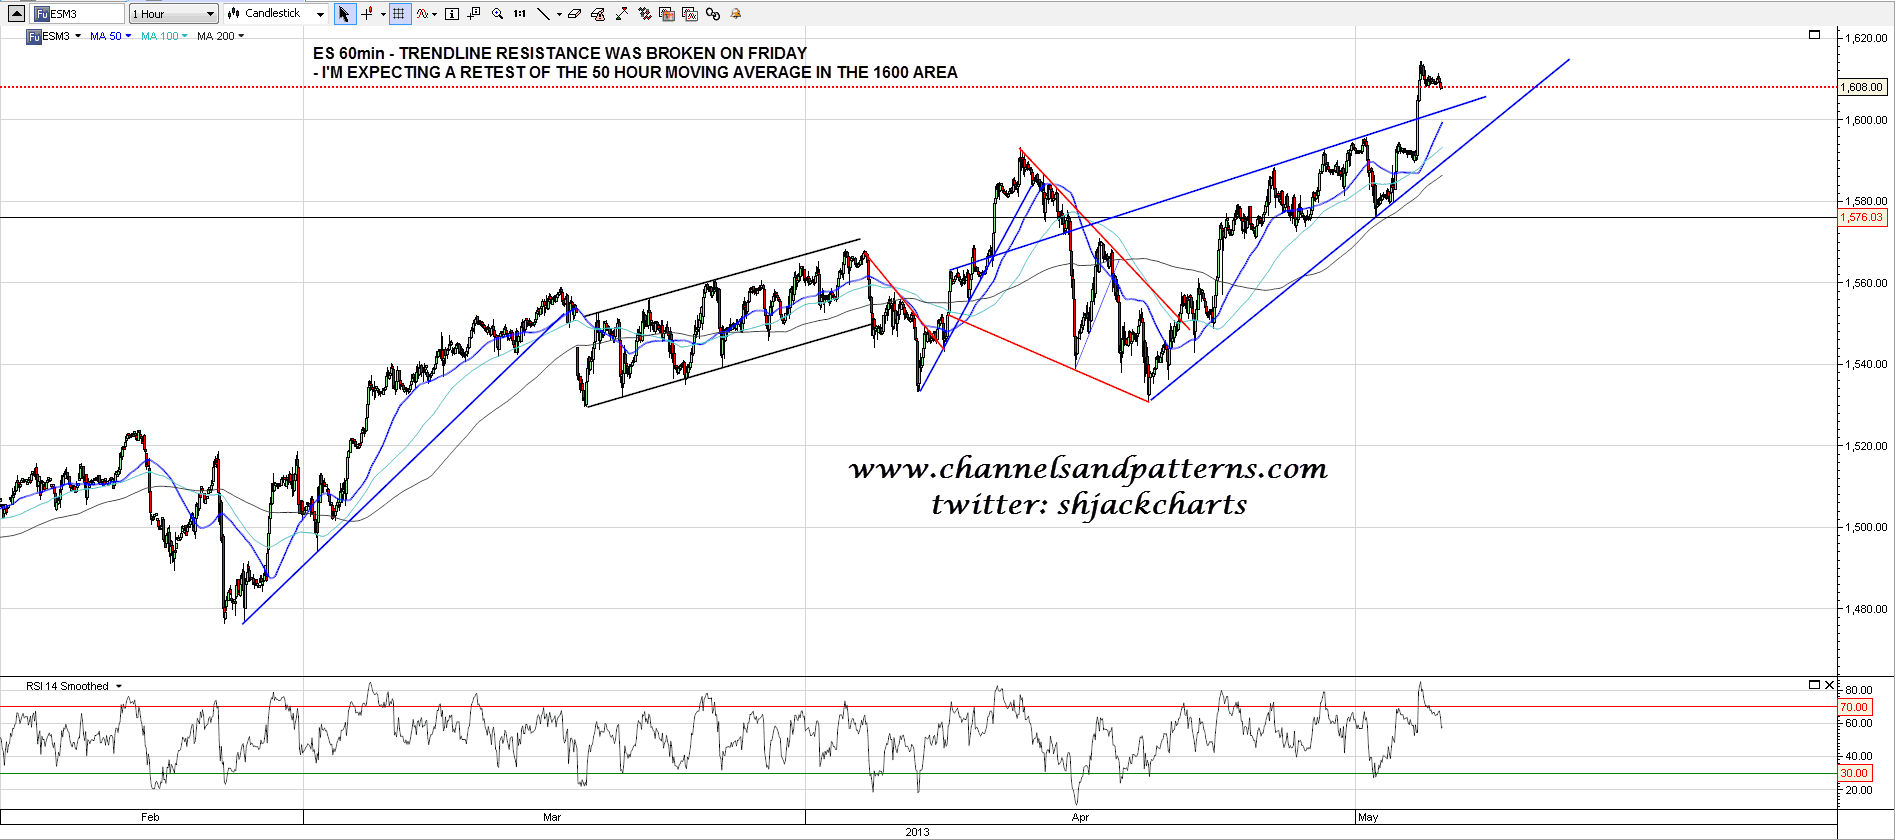
On the ES 60min chart trendline resistance was also broken, but I would normally expect a test soon of the 50 hour moving average, and that’s at just under 1600:
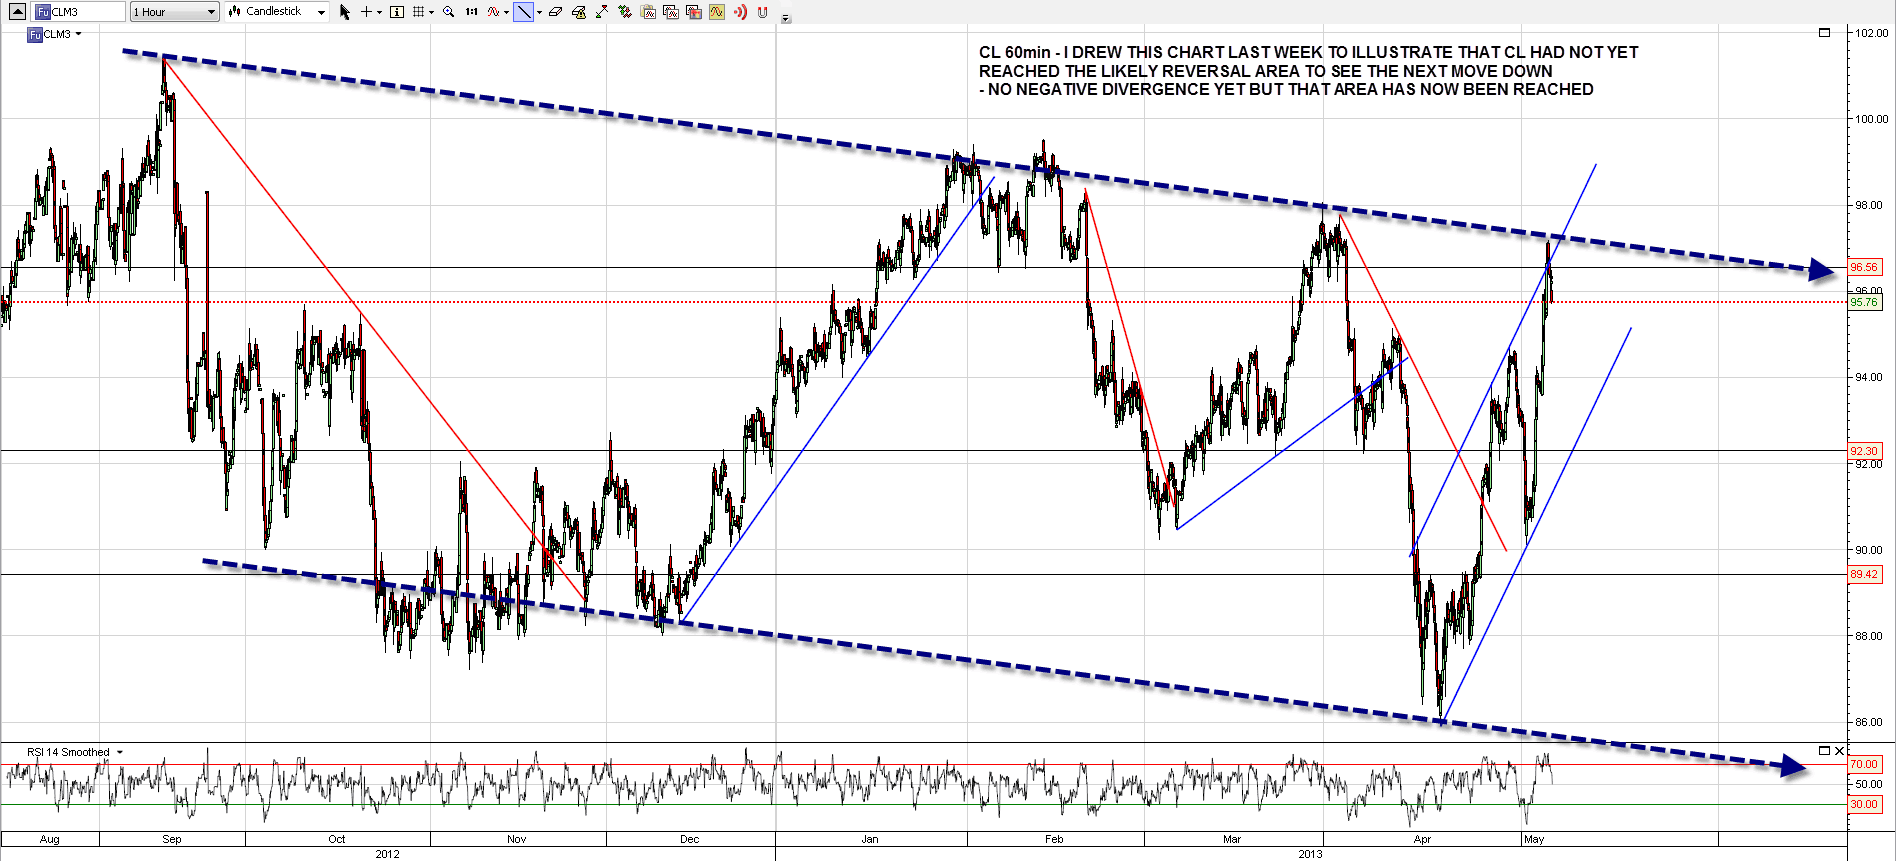
Another very strong push up on CL on Friday. So strong in fact that it broke the resistance trendline on my rising channel there. When we saw the last interim high a few days ago I posted a chart showing the area where I would expect this move to top out and we have now reached that area. A significant reversal so far but no negative RSI divergence:
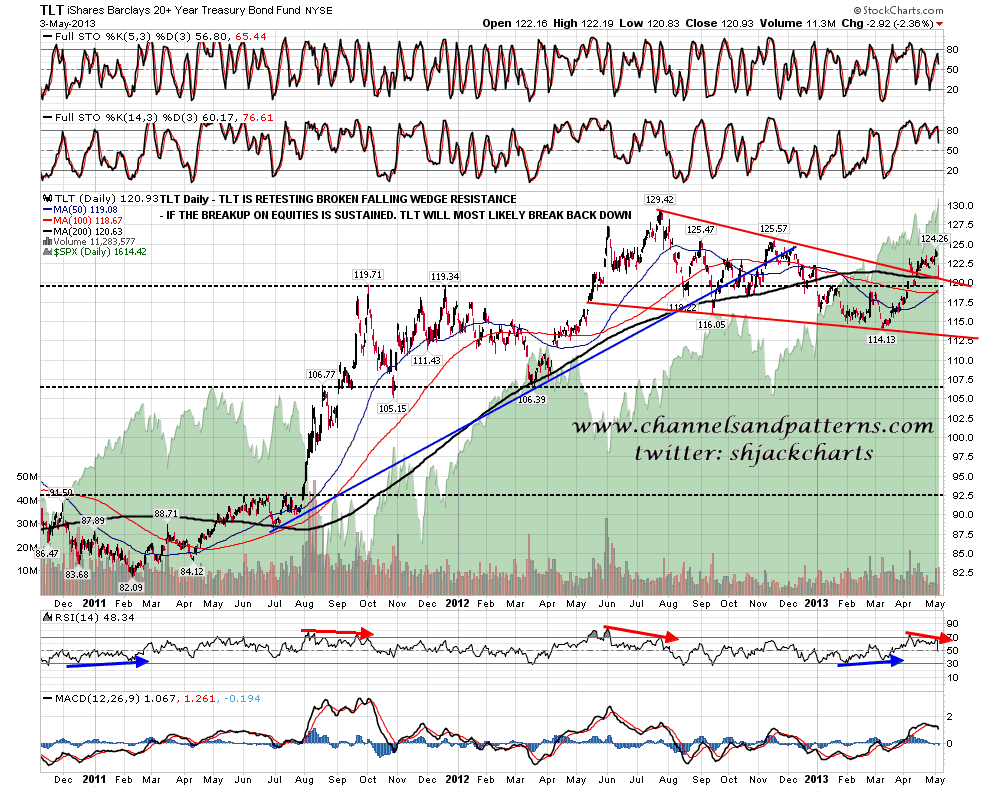
TLT reversed down hard to test broken falling wedge resistance on Friday.If SPX holds this break up I’m expecting TLT to continue down here:
How significant was the break up on Friday? In my view very significant. Some major trendlines were broken and the topping scenarios across various indices for a spring high here were seriously weakened or trashed altogether. Perhaps we really won’t see a decent retracement on equities until the current round of QE finished. We could see a strong reversal right here which would partially negative Friday’s breakout, but it’s more likely that we’ll now see continuation into the 1650-1700 area. Short term I’m looking for a test of the ES 60min 50 hour MA in the 1600 area.
