
Most days recently I’ve been posting a rising channel from the 1536 low, and I posted on twitter yesterday that channel resistance was hit at 1684.6 and there was leeway for a push through to 1685/6. I was frankly irritated when SPX then reached 1687.18, which was a clear breach of my channel resistance trendline.
I have commented before though that sometimes we see a pinocchio through a smaller pattern or channel trendline to reach a target trendline on a larger pattern, and with that high yesterday the pattern from the November low has finally been clarified. That pattern is a perfect broadening ascending wedge, and you can see that on the SPX 60min chart below:
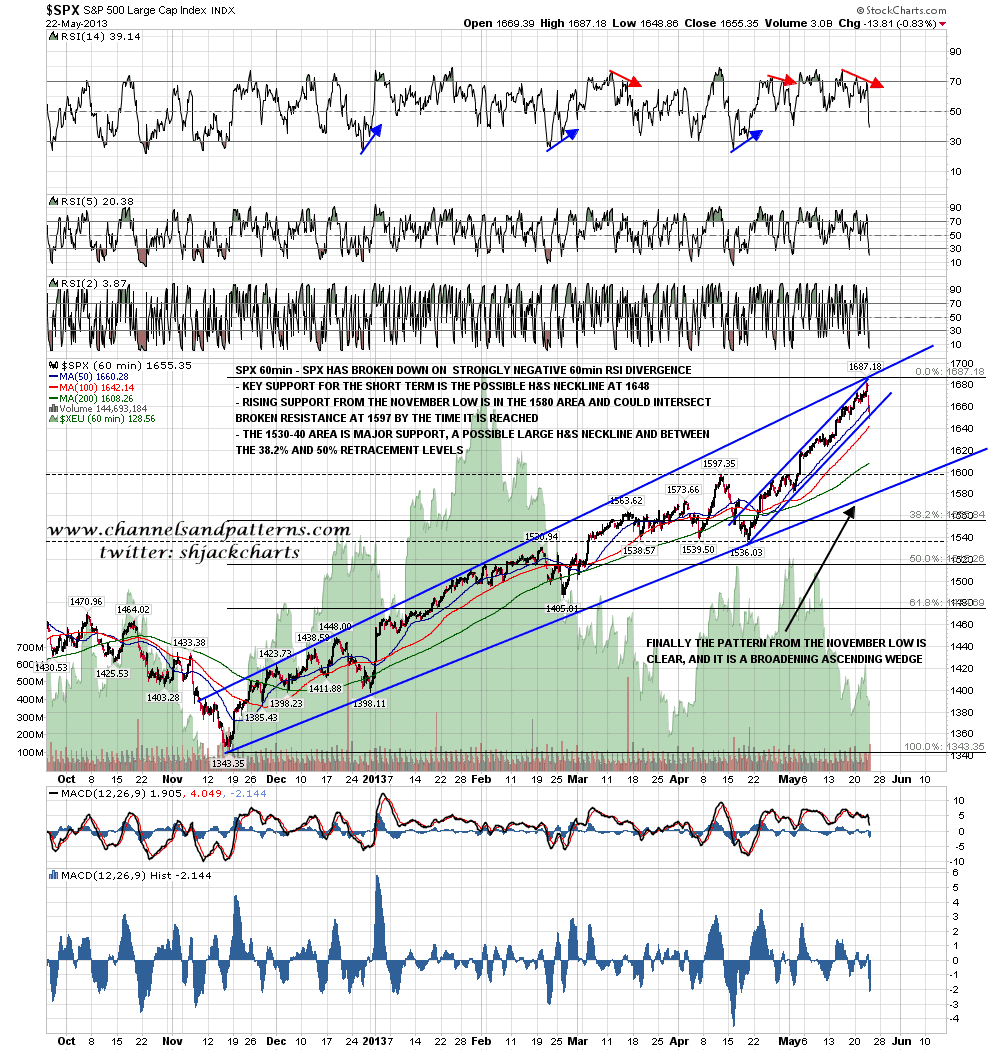
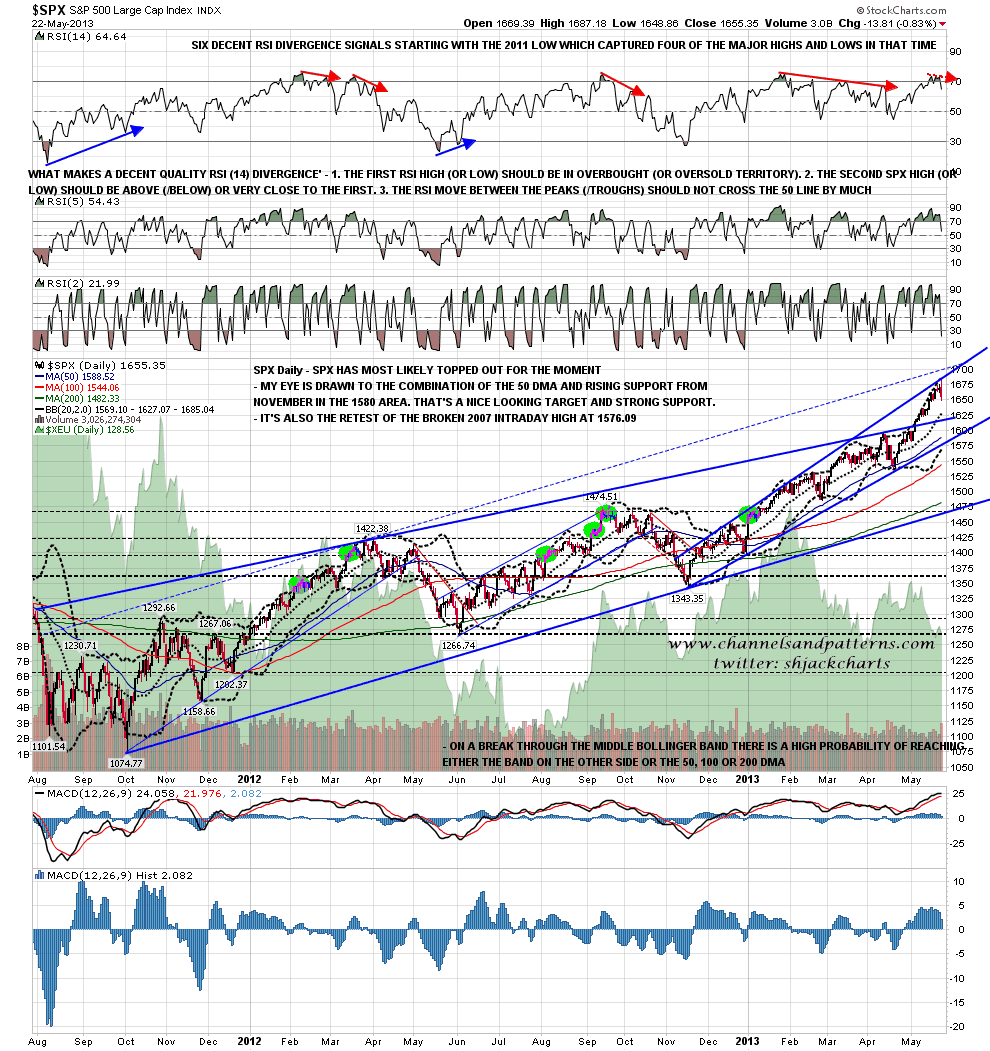
That being the case, the obvious target for a retracement here is the wedge support trendline in the 1580 area. I would also note that the SPX 50 DMA is now at 1588, the daily lower bollinger band is now at 1569, and there are major broken resistance levels at 1576 (2007 intraday high) and 1597 (rising resistance from 2000 high). There is therefore a major support cluster around the wedge support trendline, and we may well see a reversal there to test the highs and set up a larger double-top for a bigger retracement:
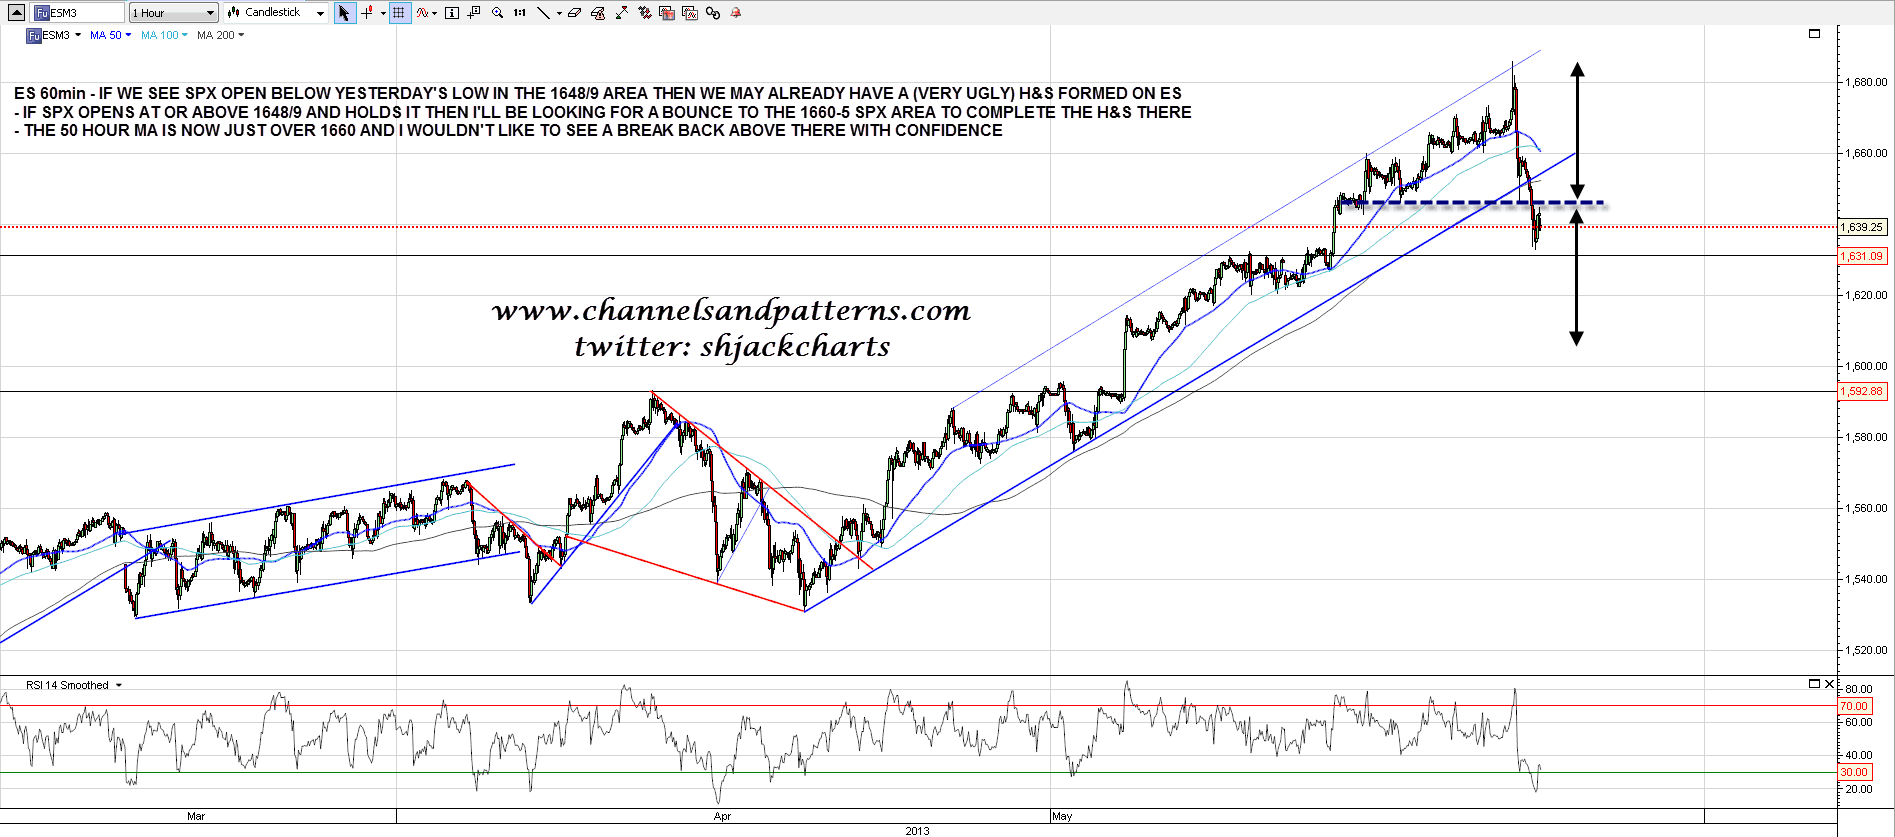
ES has broken back below yesterday’s low overnight, and I’m running two main scenarios here. If SPX opens at or above yesterdays 1648/9 area low and can hold above it I’ll be looking for a right shoulder to form on the SPX chart with a move to the 1660-5 area today. the ES 50 hour MA is now slightly above 1660 and I wouldn’t like to see a break back above that with confidence. If SPX open much below the 1648/9 area then I have a possible though extremely ugly H&S already completely formed on ES and that would have a target in the 1605-10 area:
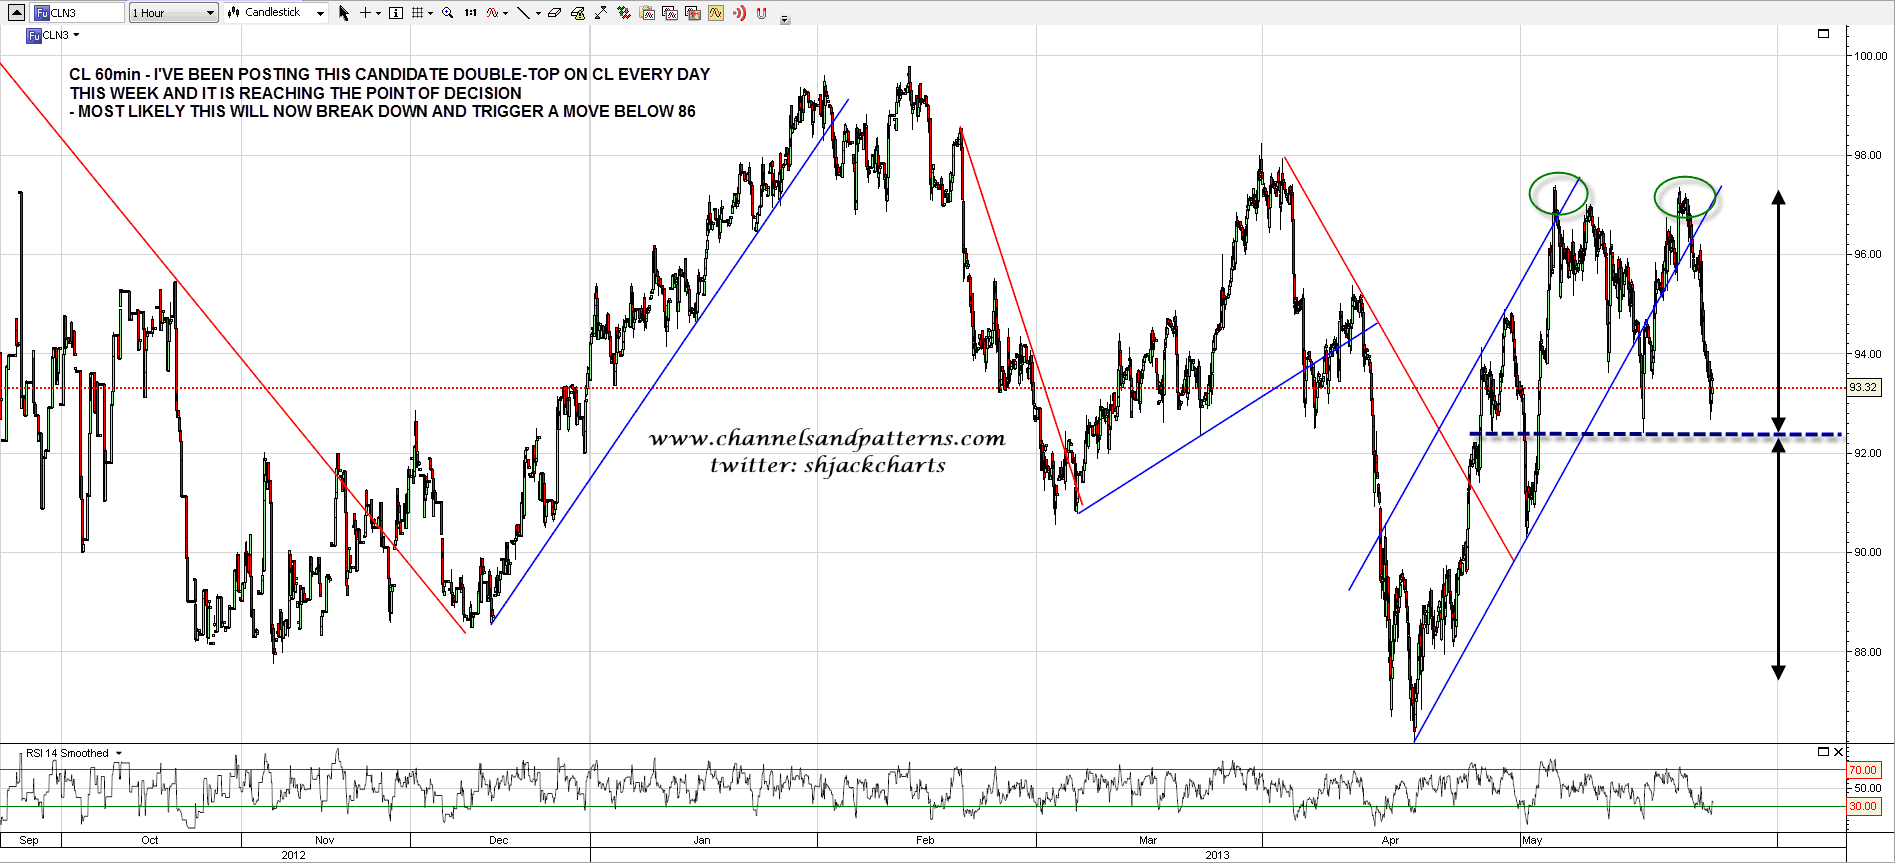
On CL I’ve been posting the candidate double-top there every day this week and that is reaching the point of decision. If CL breaks below it then I’ll be expecting a move to under 86 after that break to maintain the lower highs and lows on the bigger picture charts:
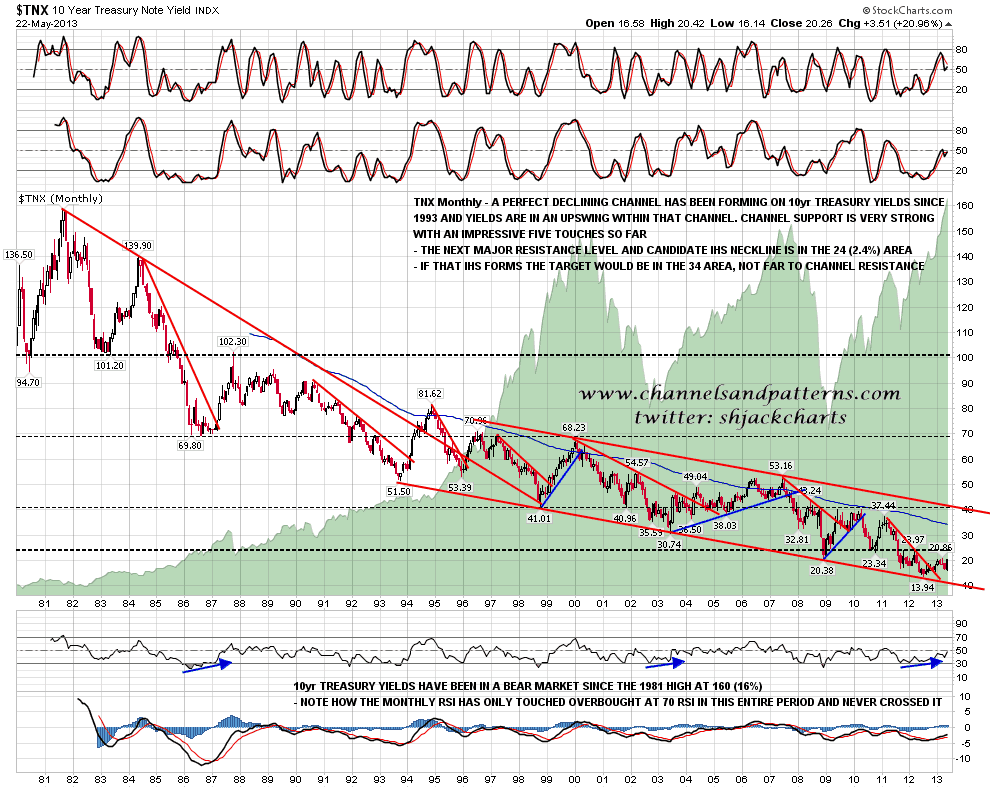
I’ve been saying regularly that I think the greater trend on bonds is down, and that the bull market from 1980 on bonds may have ended, and I’ll show another chart to support that this morning. That chart is the TNX (10yr Treasury Yield) monthly chart from 1980 and you can see the very strong support trendline that was hit for the fifth time in mid 2012 to start the current bounce. That may or may not be the end of the multi-decade bull market, but we’ll have to see whether rates can get over 4% to confirm that. I’ve been reading quite a few comments that this multi-decade bull market ended on April 29th this year and I’ve no idea why that is. If that bull market has ended, it plainly ended last summer:
What I’m looking for on ES today is already stated above so I’ll just repeat that here – ES has broken back below yesterday’s low overnight, and I’m running two main scenarios here. If SPX opens at or above yesterdays 1648/9 area low and can hold above it I’ll be looking for a right shoulder to form on the SPX chart with a move to the 1660-5 area today. the ES 50 hour MA is now slightly above 1660 and I wouldn’t like to see a break back above that with confidence. If SPX opens much below the 1648/9 area then I have a possible though extremely ugly H&S already completely formed on ES and that would have a target in the 1605-10 area:
