Slope of Hope Blog Posts
Slope initially began as a blog, so this is where most of the website’s content resides. Here we have tens of thousands of posts dating back over a decade. These are listed in reverse chronological order. Click on any category icon below to see posts tagged with that particular subject, or click on a word in the category cloud on the right side of the screen for more specific choices.
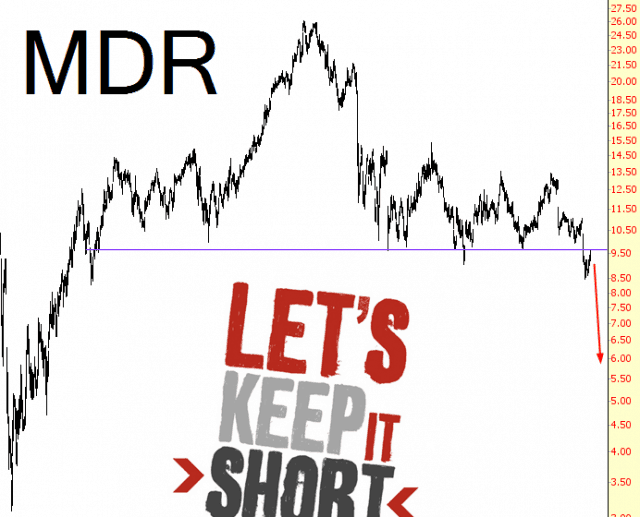
Will They Allow More Volatility?
It’s been a really good day for me so far, which is icing on the cake to the terrific Friday we had. One thing concerns me, though – – in the past, the traitorous Powers That Be have knocked down any bearish excitement any time we approach the trendline shown below. Any volatility spike gets tamped down, and subsequent spikes are smaller each time. For four years we’ve been wondering if “this time” is the start of something bigger, and every time the answer has been “nope.” (more…)
Break then Retest
Mainly an equities post today as the action there on Friday was very interesting, and should follow through this week. On SPX the daily middle bollinger band was broken and I have marked the three main support levels to watch on the chart. They are the daily lower BB at 1612, the 50 DMA at 1600 and the primary target is of course the broadening ascending wedge trendline, now in the 1590 area. SPX daily chart: (more…)
June 3rd, 2013, E-mini Prep work
Technically, Friday broke the daily trend and momentum. However there were key volume profile areas below that were tested and have for the time being provided support.
Support 1626.25-1628.00
Mid-Point: 1641.00-1643.50
Resistance: 1657.00-1659.00
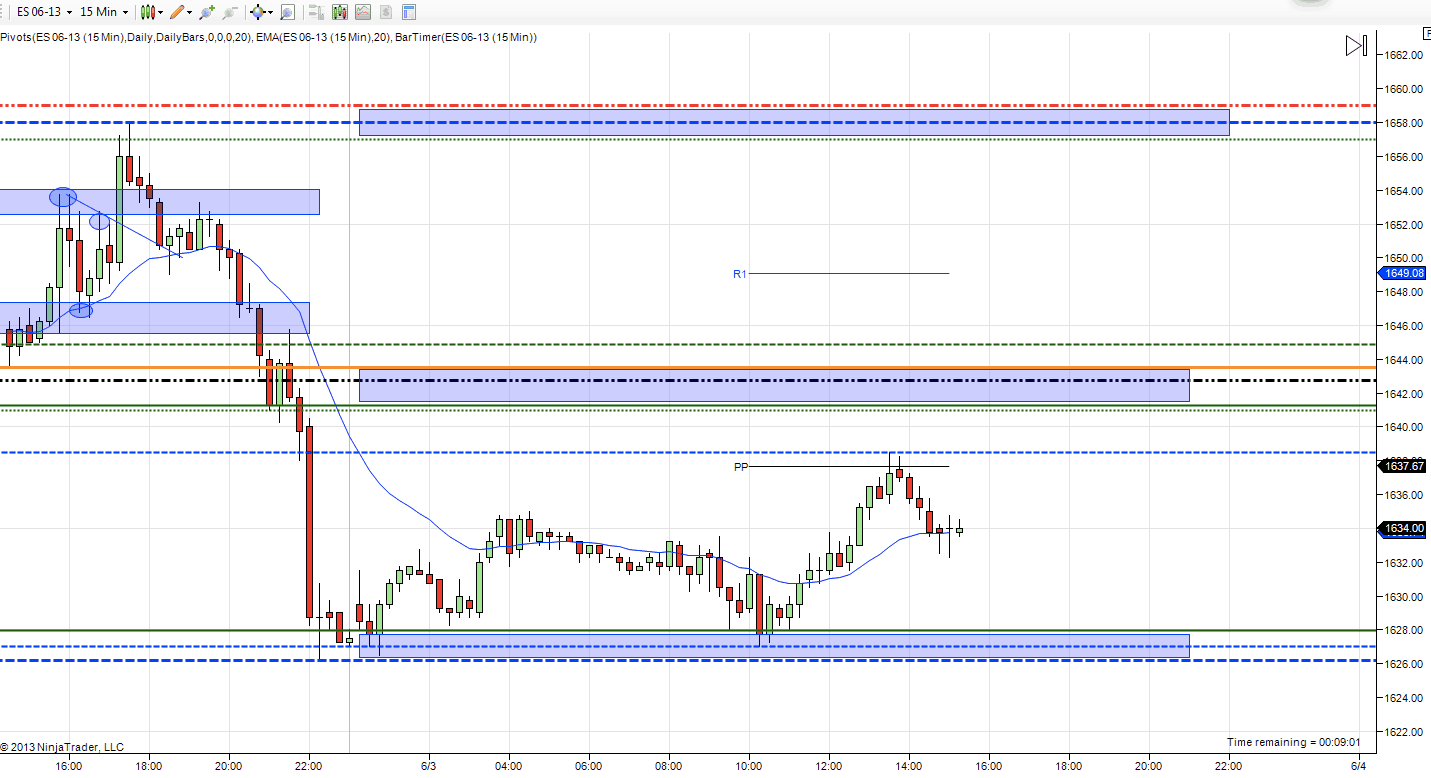
Big number at 10am EST today, are good numbers good or bad for the market now? No need to re-invent the wheel just manage your risk prior to the release.
