
Well, as much of a kick Wednesday was, Thursday and Friday were kind of a drag. For a fresh perspective on the market, I decided to focus on sixty days of trading data using sixty-minute bar charts. They don’t vary that wildly, but hopefully they will give you (and me) a bit of insight into this often-perplexing market of ours.
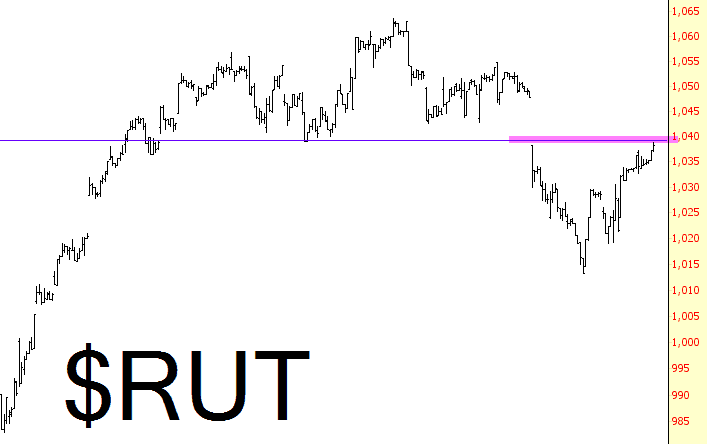
First up, and my favorite, is the Russell 2000. The topping pattern is plain as day, and the strength we saw late in the week carried us up to what I consider an important resistance zone. It would be sweet if the trading gods let things start slipping straightaway with the new week.
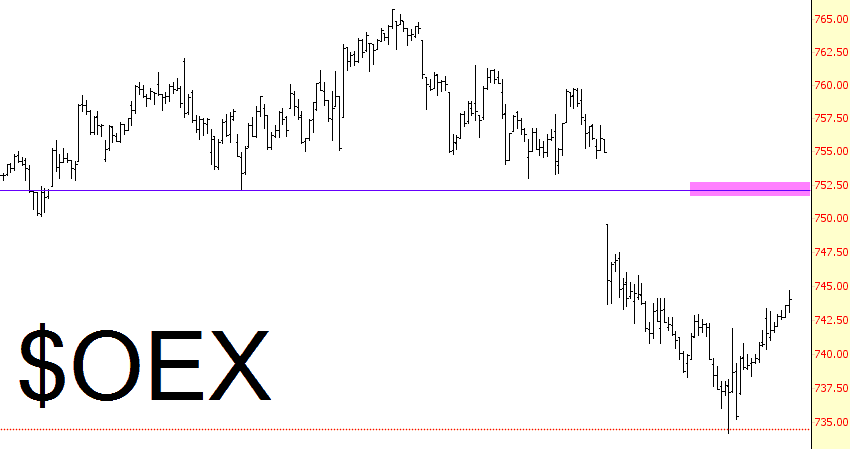
Some indexes don’t look done with their retracement (unless the market is so weak that they simply won’t be able to muster it all the way back). The S&P 100 is a good example:
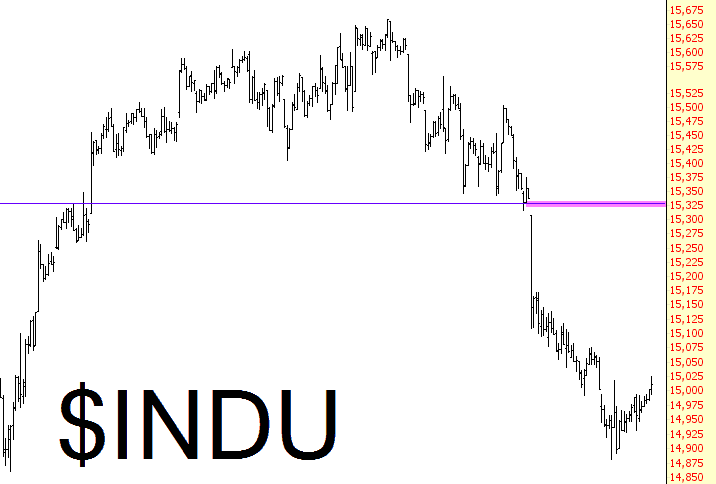
This is even more true with the Dow 30, but let’s face it, the Dow has been incredibly weak lately. Maybe it just doesn’t have the juice left. All the same, there’s 300 points of upside before there’s any serious damage done to the bearish case.
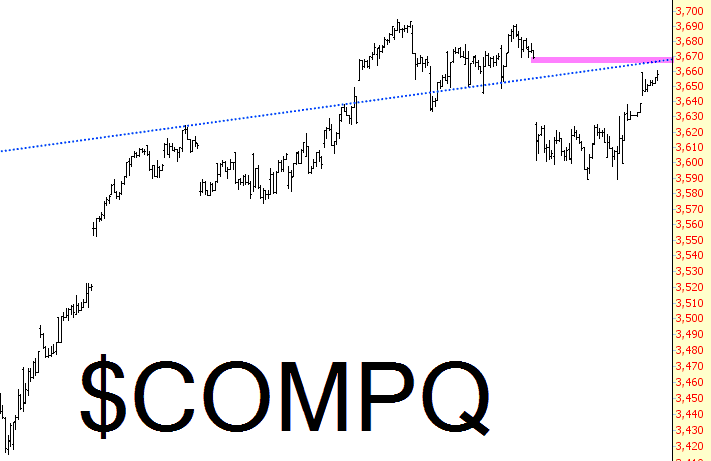
Like the Russell, the NASDAQ looks closer to its retracement completion……..assuming they can manage to keep their computers up and running.
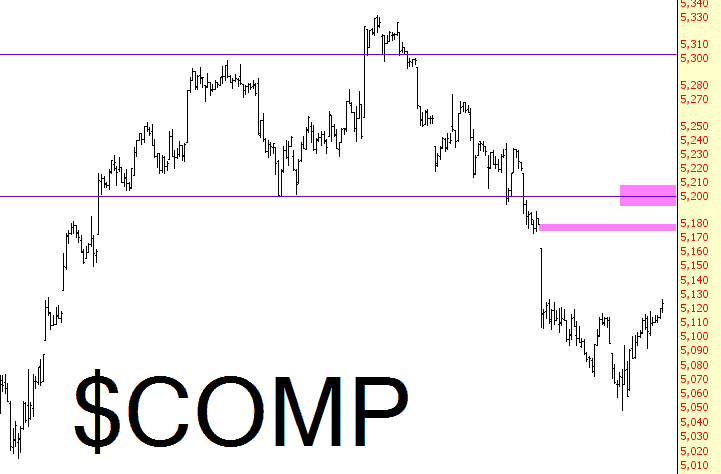
Last up is the Dow Composite, on which I’ve drawn two potential retracement levels. There’s the gap fill at about 5180, and just twenty points above that is more major resistance at 5200.
My last day of “vacation” is Monday, and I’ll be back late that night. I should be back in the saddle, more or less 100%, bright and early Tuesday morning.
