
Hi Folks,
I am on vacation for another two weeks and so I will not provide much commentary with these charts. I am going to combine the monthly and weekly charts together for this post.
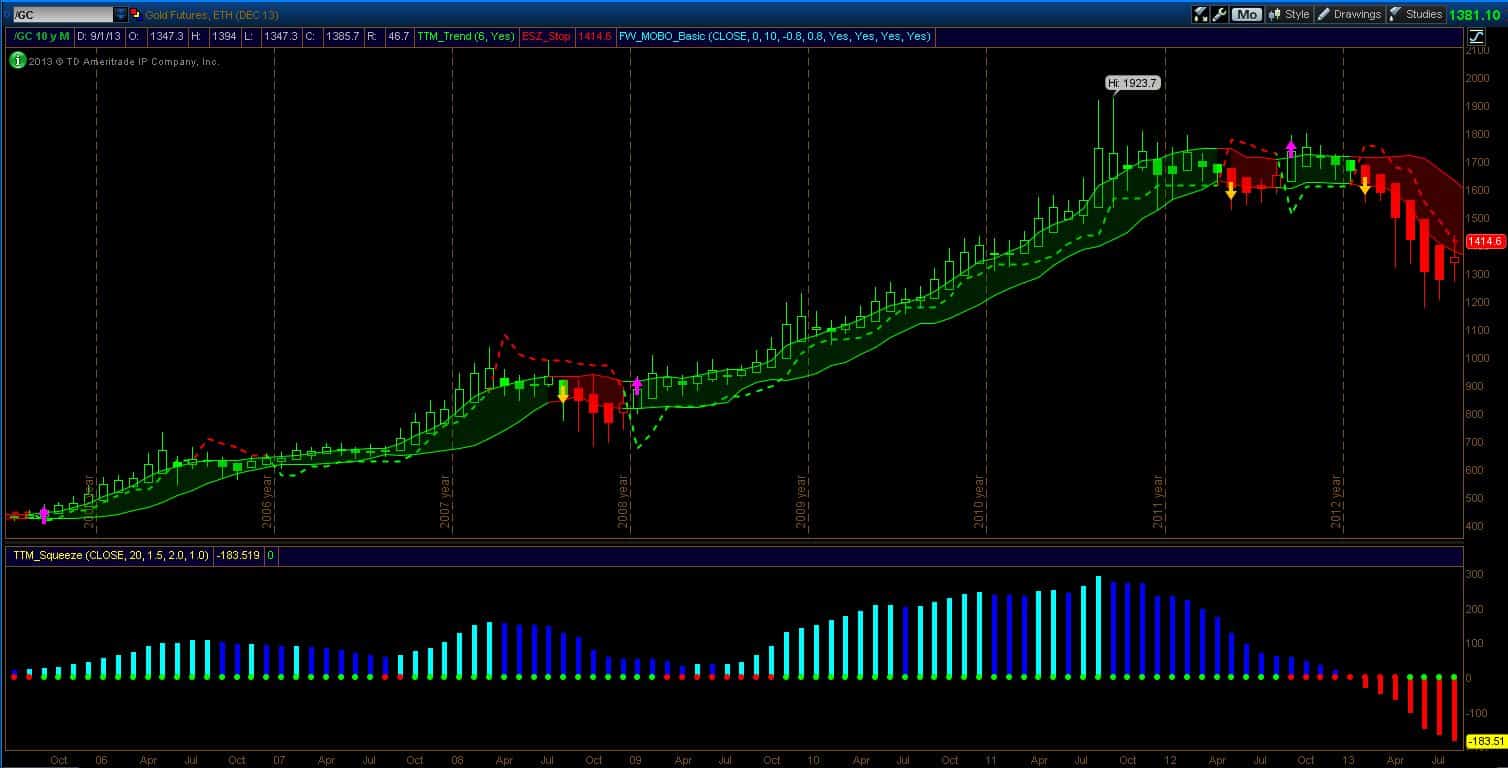
First up are the Gold charts. The Gold monthly chart is little changed from the previous monthly chart. There needs to be a monthly close above 1414 to trigger the short stop (treat it as an exit signal and not a buy signal). Selling momentum is still increasing boding for lower prices in the future. As I said previously, based on this monthly snapshot, the character of gold has changed with meaningful selling pressure not seen in the last 10 years.
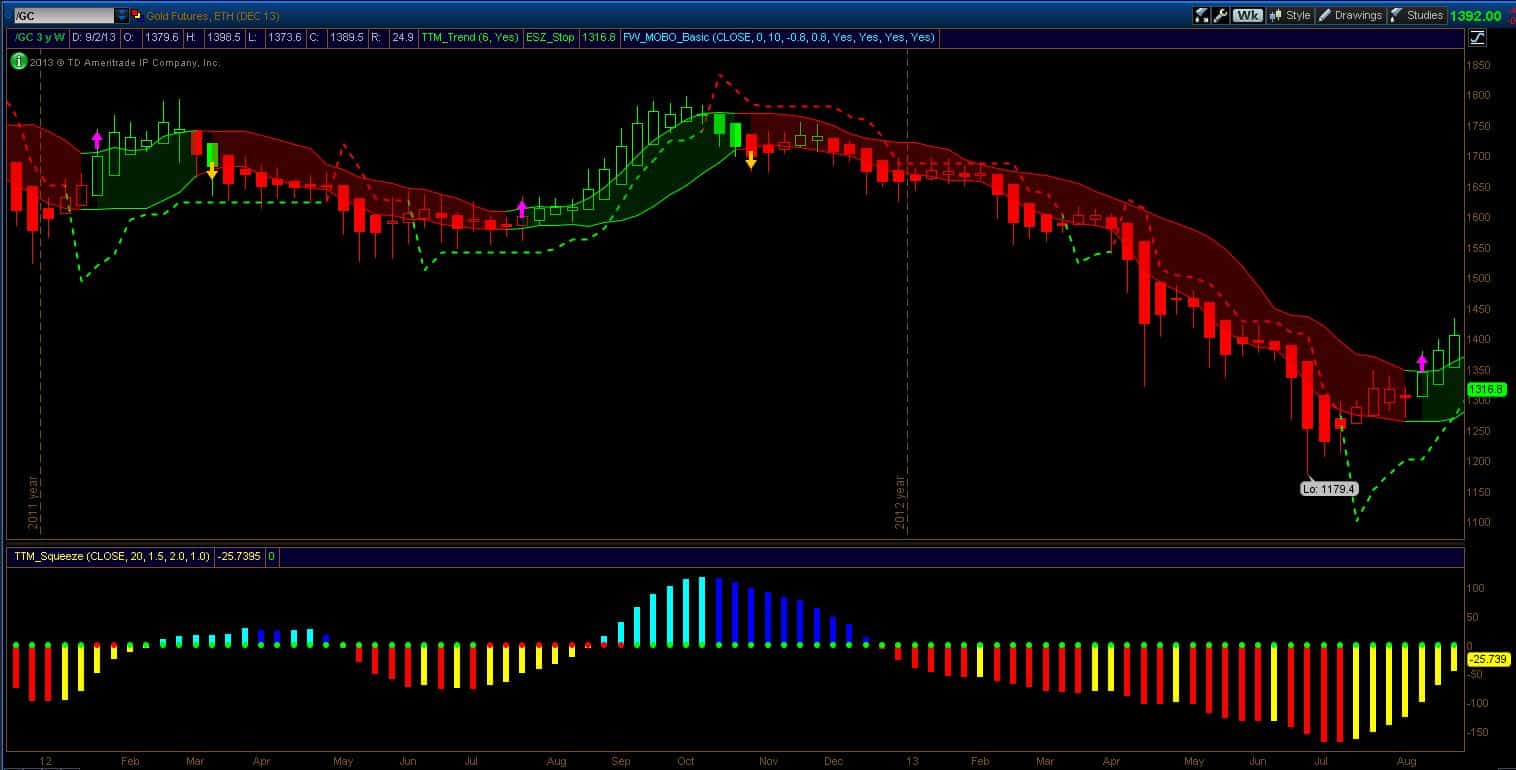
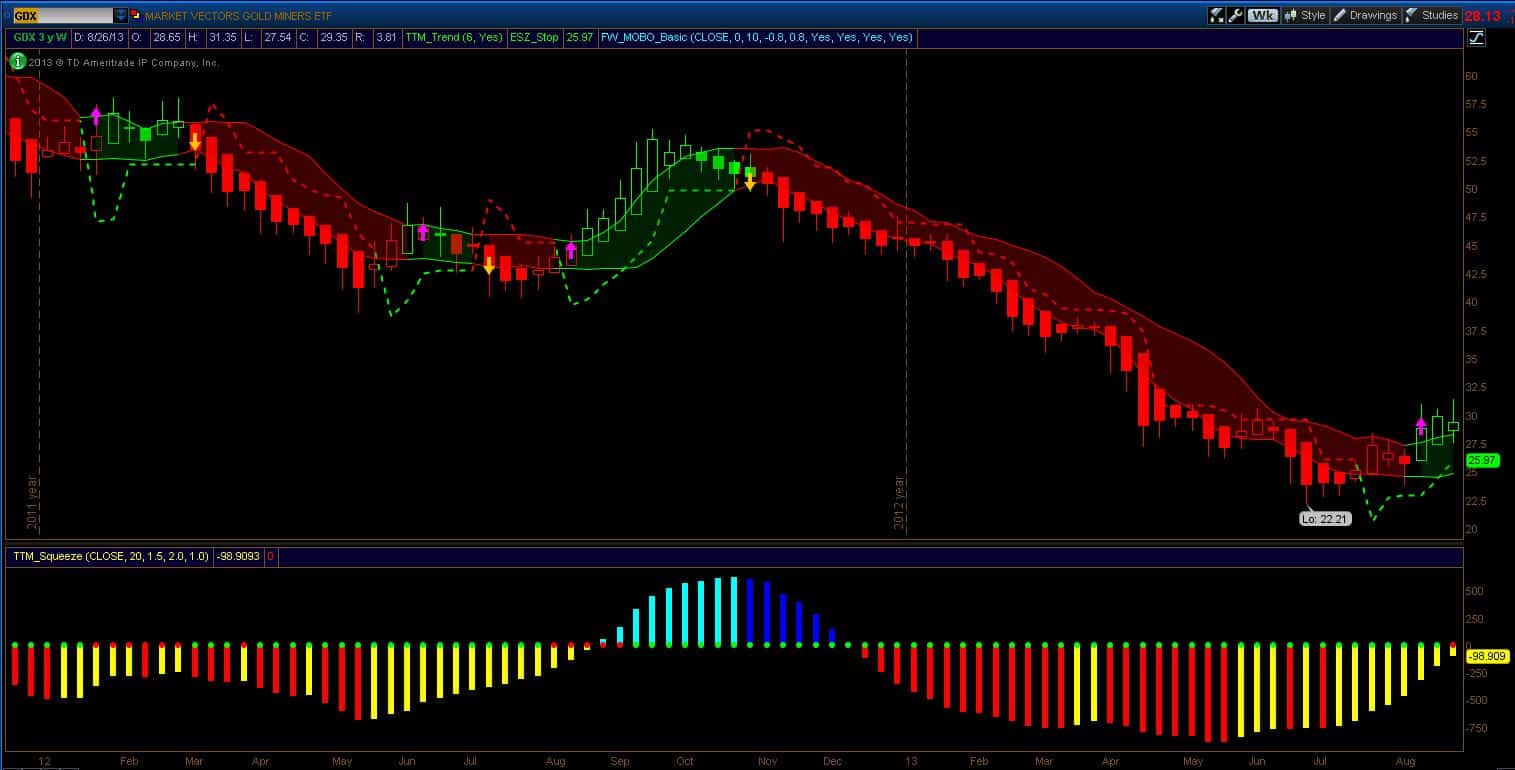
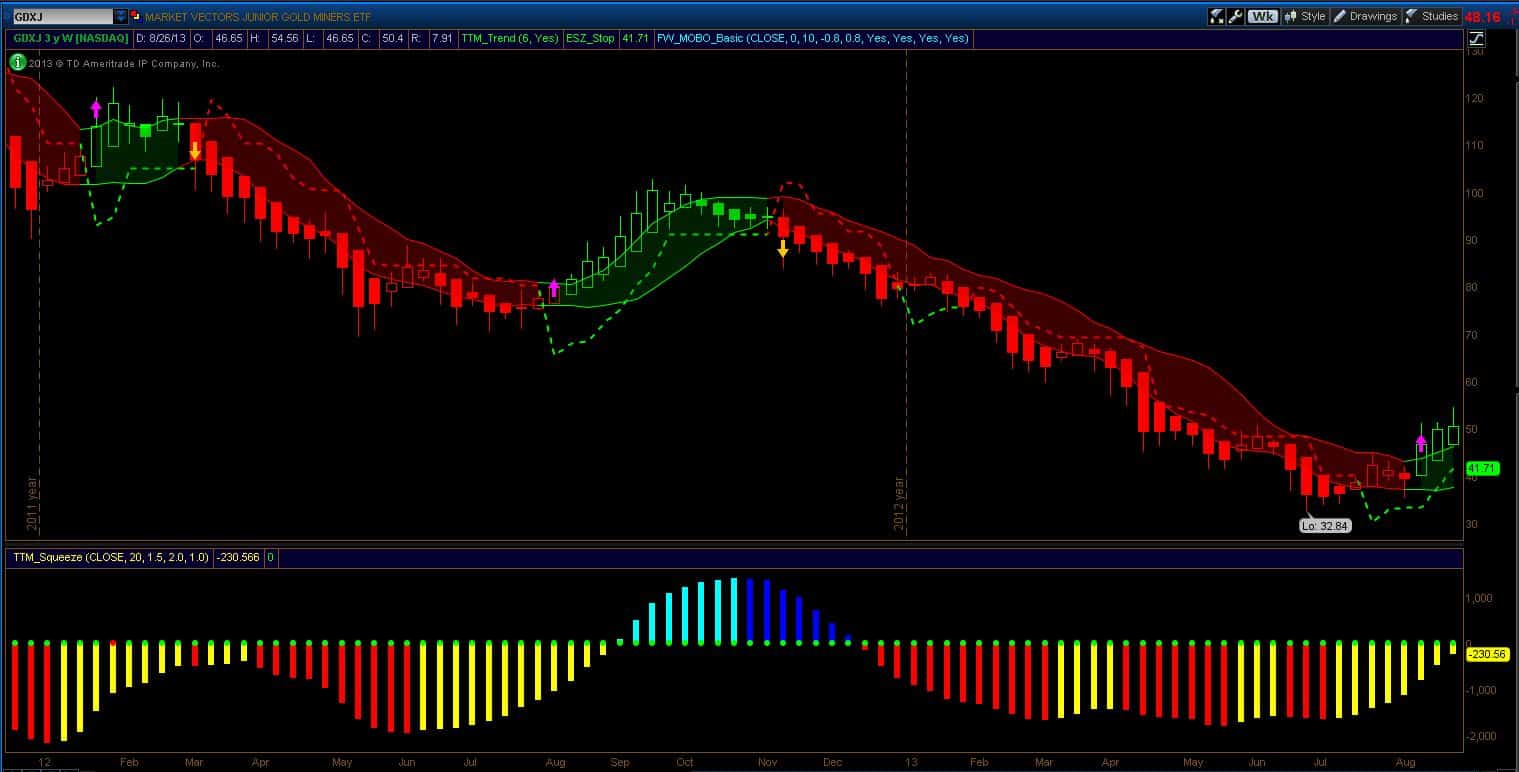
The Gold weekly chart continues to show strength. This chart has been very useful for avoiding the long down-draft in Gold and related stocks in this last year. Right now, the indicators for both Gold and Gold stocks support long positions. This dichotomy between the weekly chart and the monthly chart is typical of transitions phases. Weekly trends become monthly trends but monthly trends are more important. If these weekly signals hold long enough, the monthly picture will change but for now, the weekly signals are useful for establishing pilot investment positions knowing full well that the monthly picture makes it riskier. Stops and momentum break levels must be respected if going long. The weekly charts of GDX and GDXJ are also shown. The red dot on the Squeeze indicator for GDX is concerning because it is a sign of indecision early in the trend change. This warns of lack of conviction for this recent move.
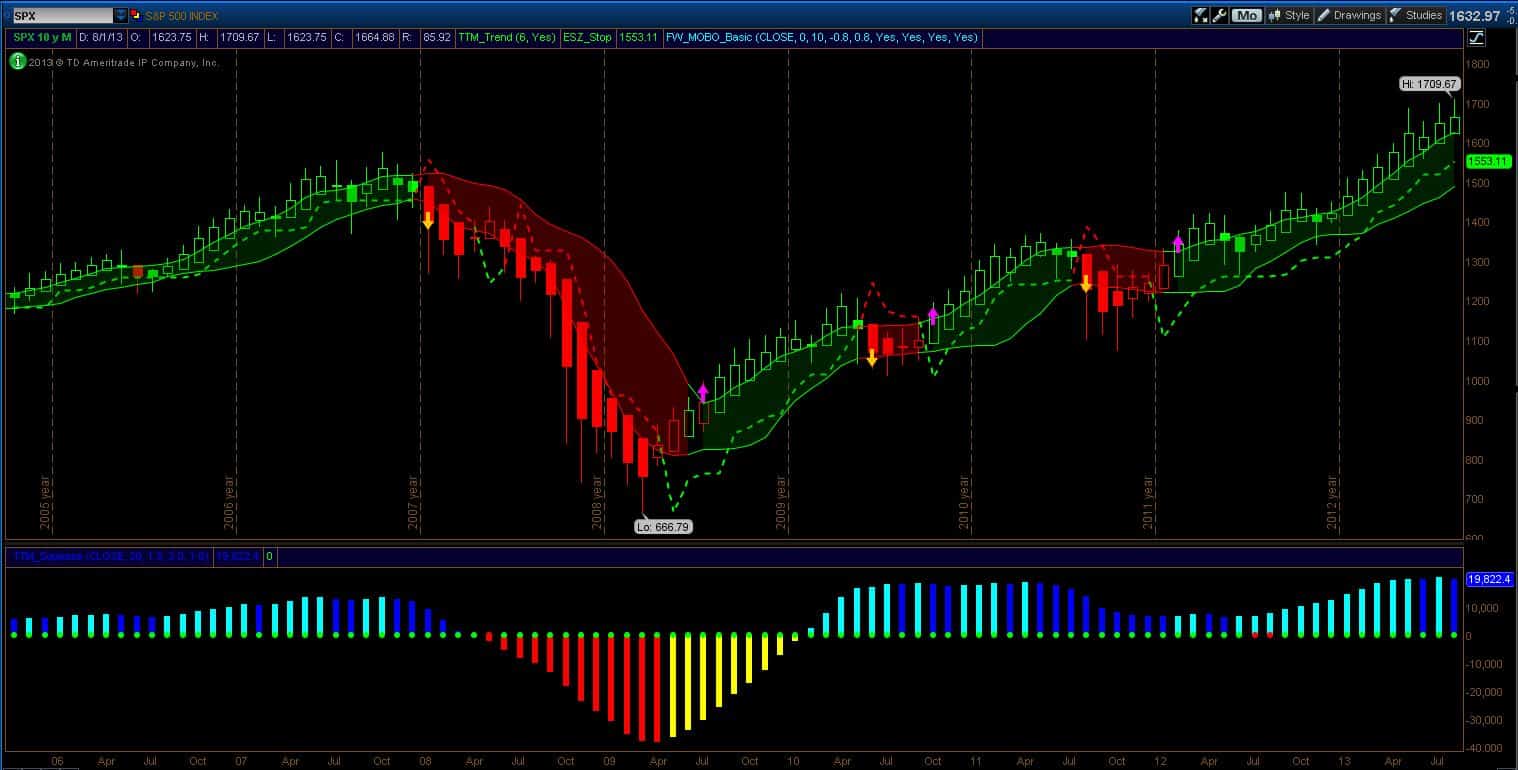
The SPX monthly chart is in a strong bull mode (now lower wicks on the HA average bars). September is a poor month for being long stocks but only some Septembers. This year we have a whole lot of news events that will likely make September more volatile than usual. The confluence of global, fiscal, monetary and political events promises to make life interesting. The only way I can look at this is from a risk perspective. I know what the charts are telling me and I know where my stop and break levels are.
The weekly chart has a new signal. Both the long stop and the lower momentum channel have triggered so being long is being wrong. These previous signals have always been short lived because of the on-going bull market. There is no way to tell if these new bearish signals are going to play out into something worse. However, this week’s signal comes quickly on the heels of the previous signal while buying momentum is waning – the bull market is nervous and it is too risky being long here without some type of hedge.

That’s all for this long weekend. It is unlikely that I will make another post during the next two weeks as I will not be watching the markets (at least from a technical perspective) as I travel to several destinations.
Good Trading!
-Dr.G
