
It came to my attention yesterday that my comment yesterday morning about the possibility of swapping ‘them’ all for a dog and then shooting the dog could be interpreted as referring to the Republicans only. Not so, as I was referring to both Houses of Congress in a non-partisan manner that was expressing general contempt for both parties.
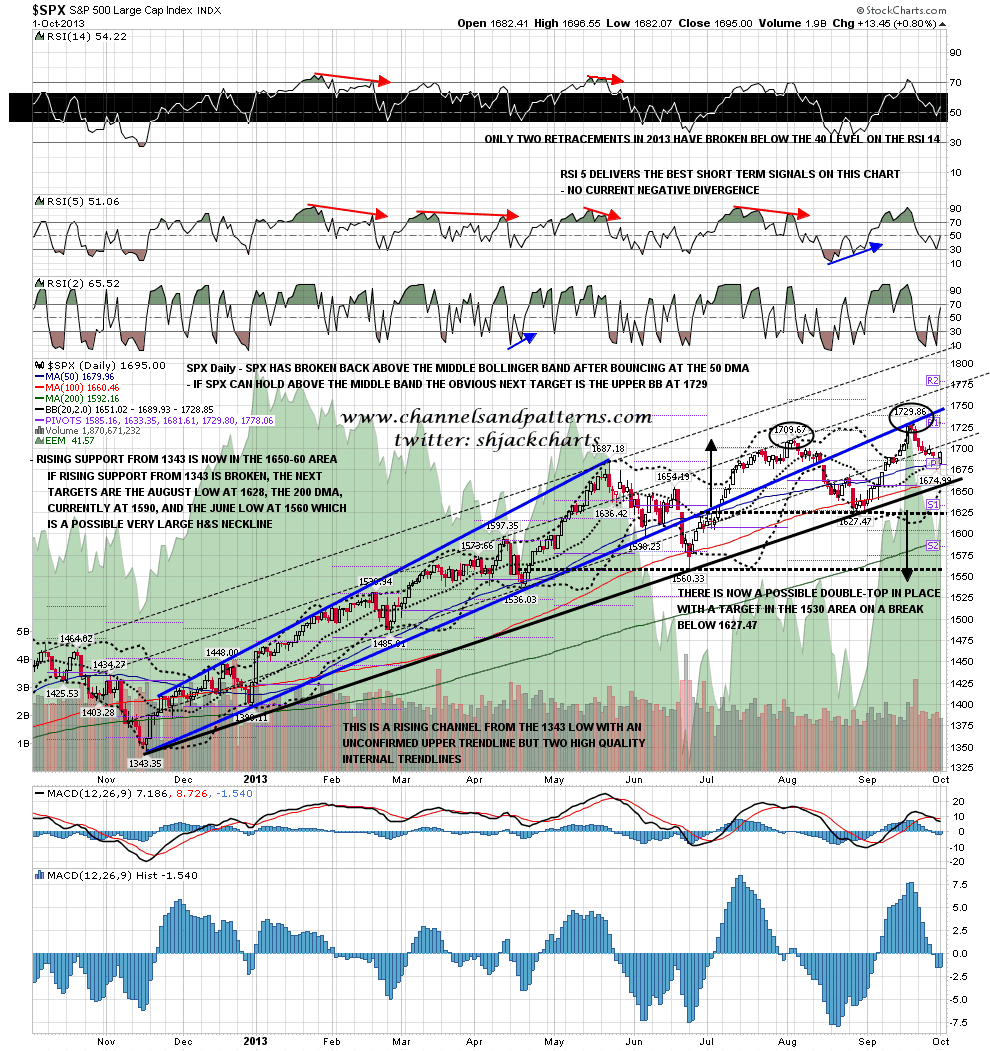
SPX held above the 50 DMA again yesterday and broke back above the daily middle bollinger band. If SPX can hold above there the next obvious target above on the daily chart is at the upper bollinger band, currently at 1729 and in effect a test of the highs. On the downside the daily lower BB is now at 1650, so that could now be tested without breaking rising support from 1323 last November, now in the 1655-60 area. SPX daily chart:
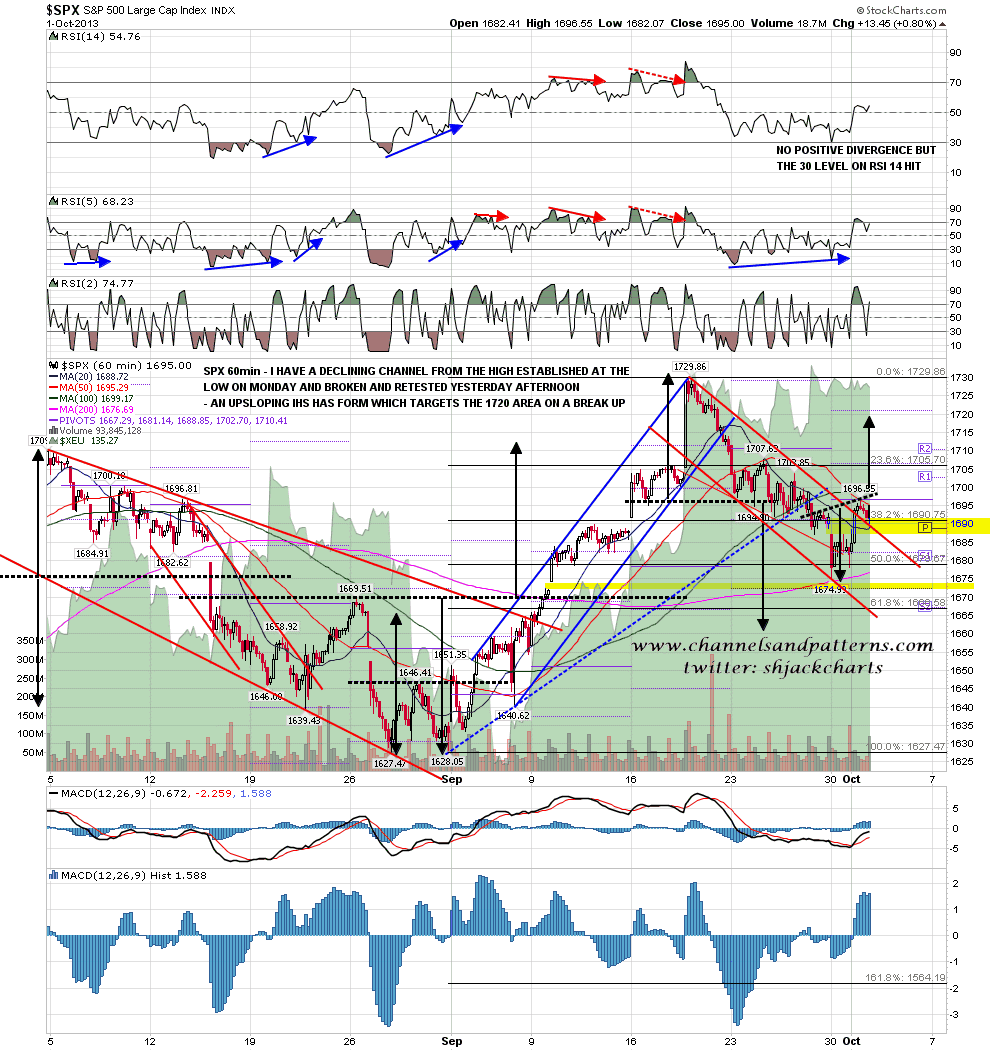
So which way from here? Sometime the SPX charts can be ambiguous, but rarely as much so as this morning, so I will present both the very nice looking bull case, and the very nice looking bear case. We should get some clarification today as to which script we will be following. On the bull side SPX broke over a falling channel on the SPX 60min, retested broken channel resistance and formed an upsloping IHS that targets the 1720 area on a break over the neckline today. This IHS wouldn’t survive an open much below 1685 SPX and would require a fast move up today. SPX 60min chart – bull scenario:
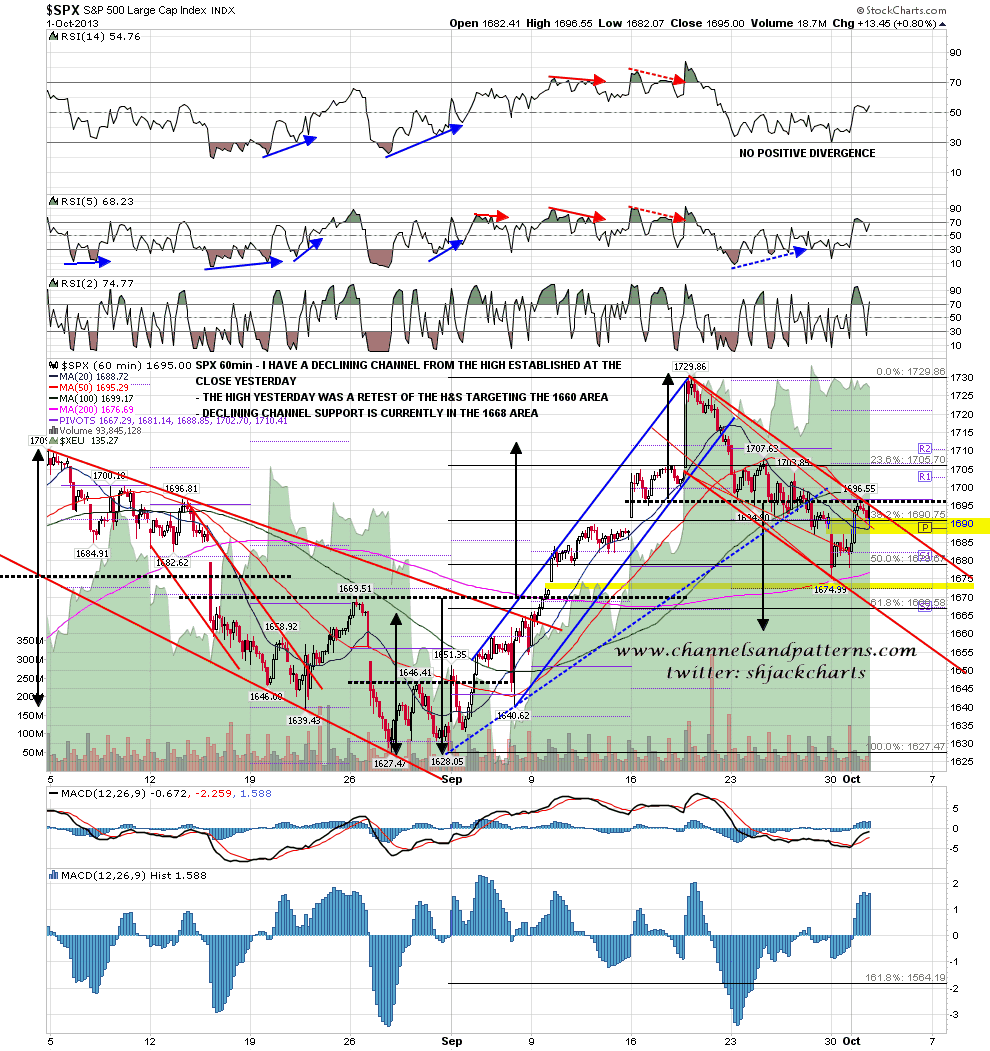
The bear scenario also looks pretty good here. A falling channel was established at the close yesterday and the intraday high yesterday was a close retest of the 50 hour MA and the neckline of the H&S targeting the 1660 area. The next downside target is falling channel support, currently in the 1668 area. SPX 60min chart – bear scenario:
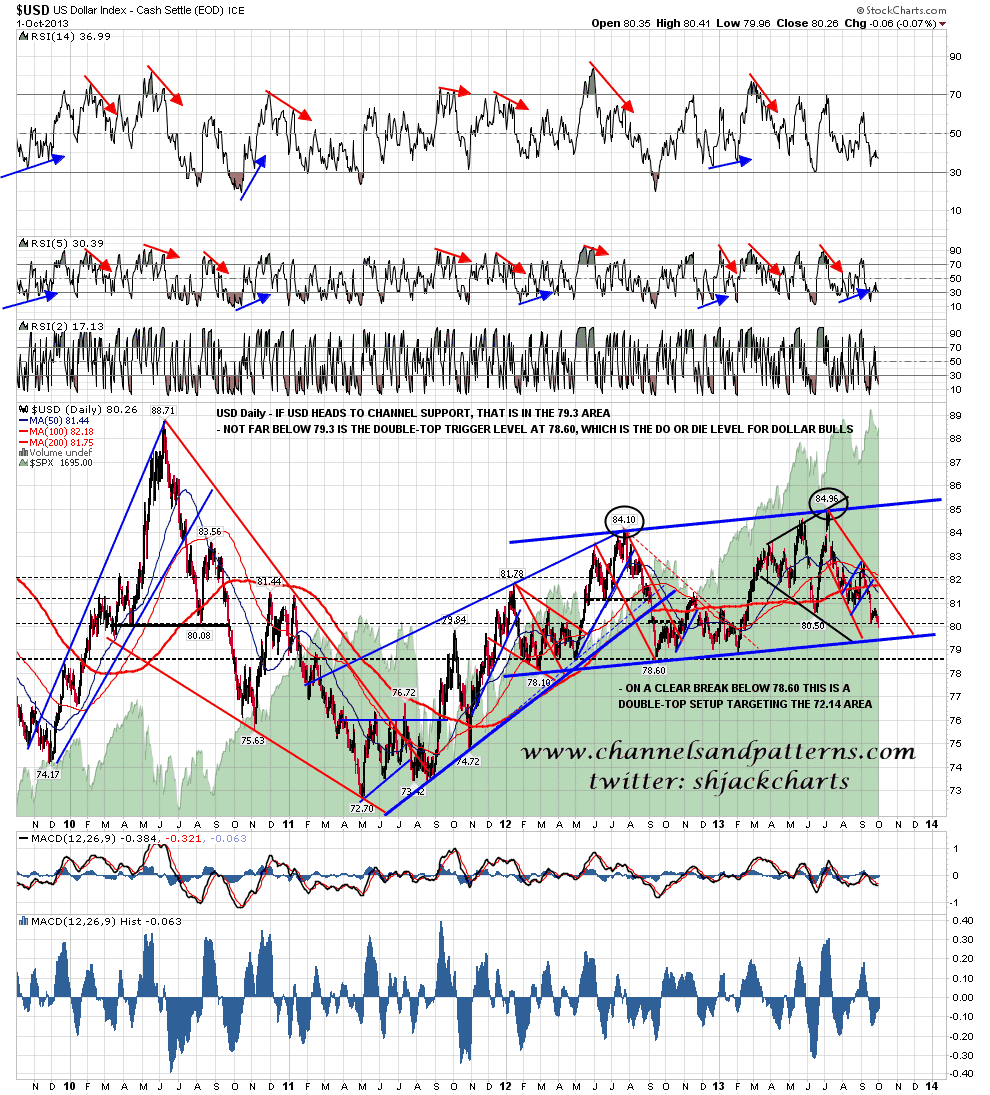
On other markets USD is trying to break below 80 area support. The obvious target just below is rising channel support in the 79.3 area. If that breaks the last ditch area for USD bulls is at 78.60, the valley low or trigger level for a possible double-top targeting the 72.14 area. USD daily chart:
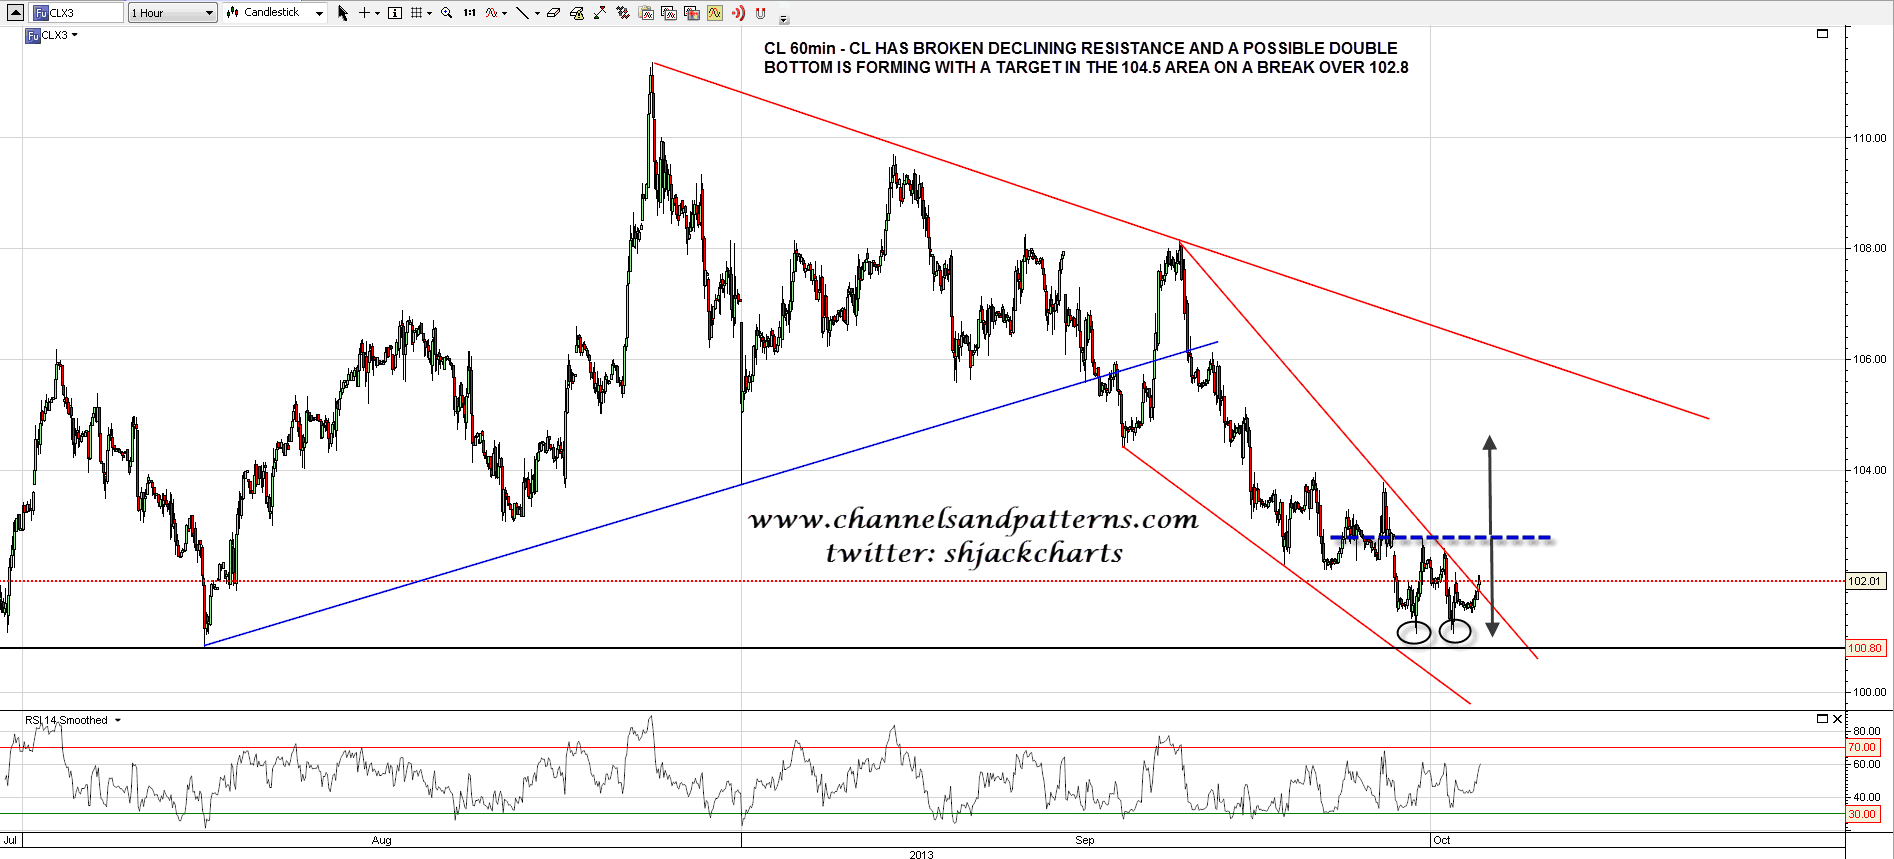
Not much to say on bonds or precious metals yet today, but CL looks interesting as it has broken over declining resistance and a double-bottom may be forming with a target in the 104.5 area on a break over 102.8. CL 60min chart:
Which way am I leaning today? Well there’s no sign of the budget deadlock breaking at the moment, and it is evolving into a budget and debt ceiling deadlock that could cause a technical default on US treasuries in a couple of weeks. This could get very ugly. If we see the currently huge opening gap filled today, ideally opening over 1685 on SPX and dipping no lower, then the bull scenario looks technically very good. If we see a weak open much below 1685 SPX then the possible bull case IHS will be lost and a break below overnight support just above 1675 ES (approx 1681 SPX) would look bearish. A key bull/bear level today is the 50 hour MA, currently in the 1681 area, which is where the overnight bounce failed. We should make at least an attempt to fill the opening gap, which may well fail near the 50% retrace level between the open and yesterday’s close.
