
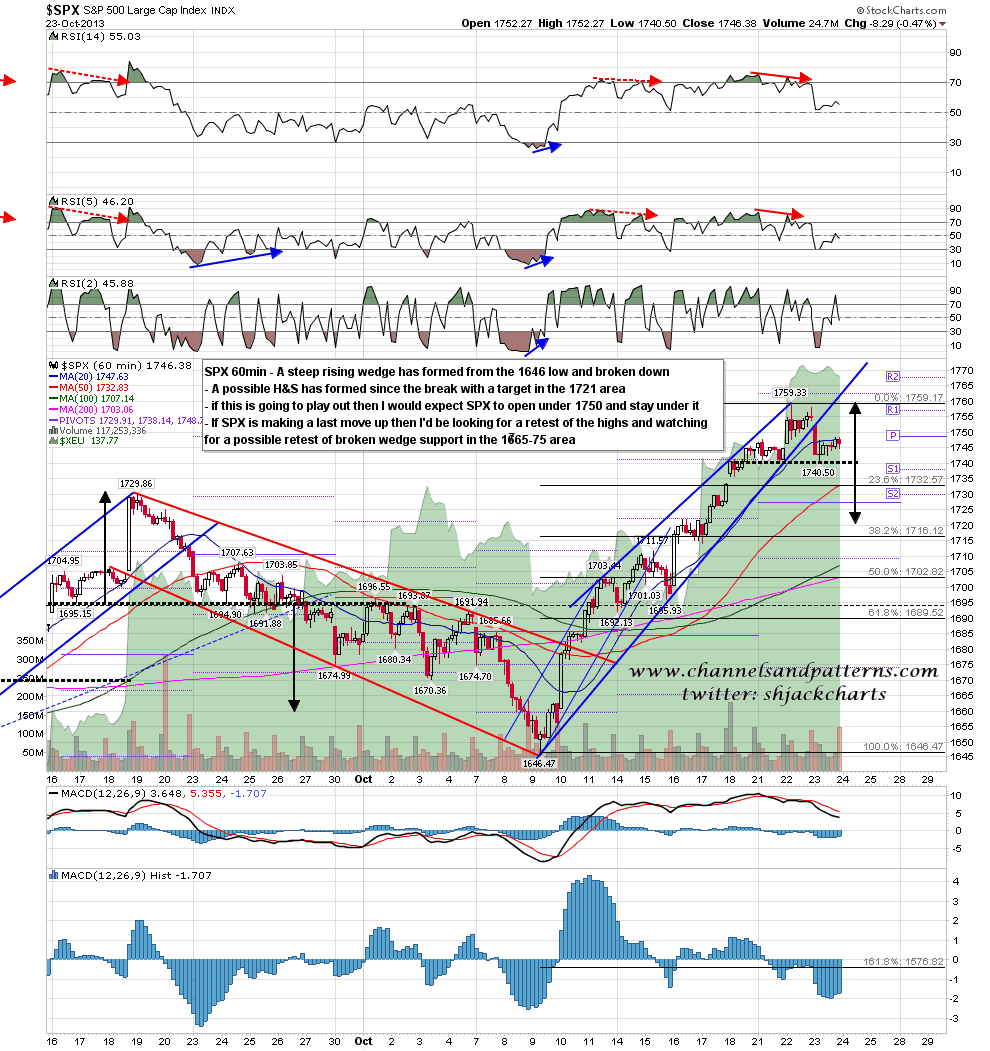
Yesterday’s trading on SPX was ambiguous about whether a top had already been made, particularly at the close. The SPX rising wedge had obviously broken down and I gave the options of a retest of the highs or an H&S to form in yesterday’s post. What we saw was the H&S option form and at the close yesterday that was looking pretty good. ES broke up overnight but at the time of writing has given back most of the overnight gains, and if SPX can open under 1750 then that H&S will still be looking pretty good. If SPX breaks up I’ll be looking first for a retest of the highs and on a break above that I’d be looking for a short term top in the 1765-75 range. SPX 60min chart:
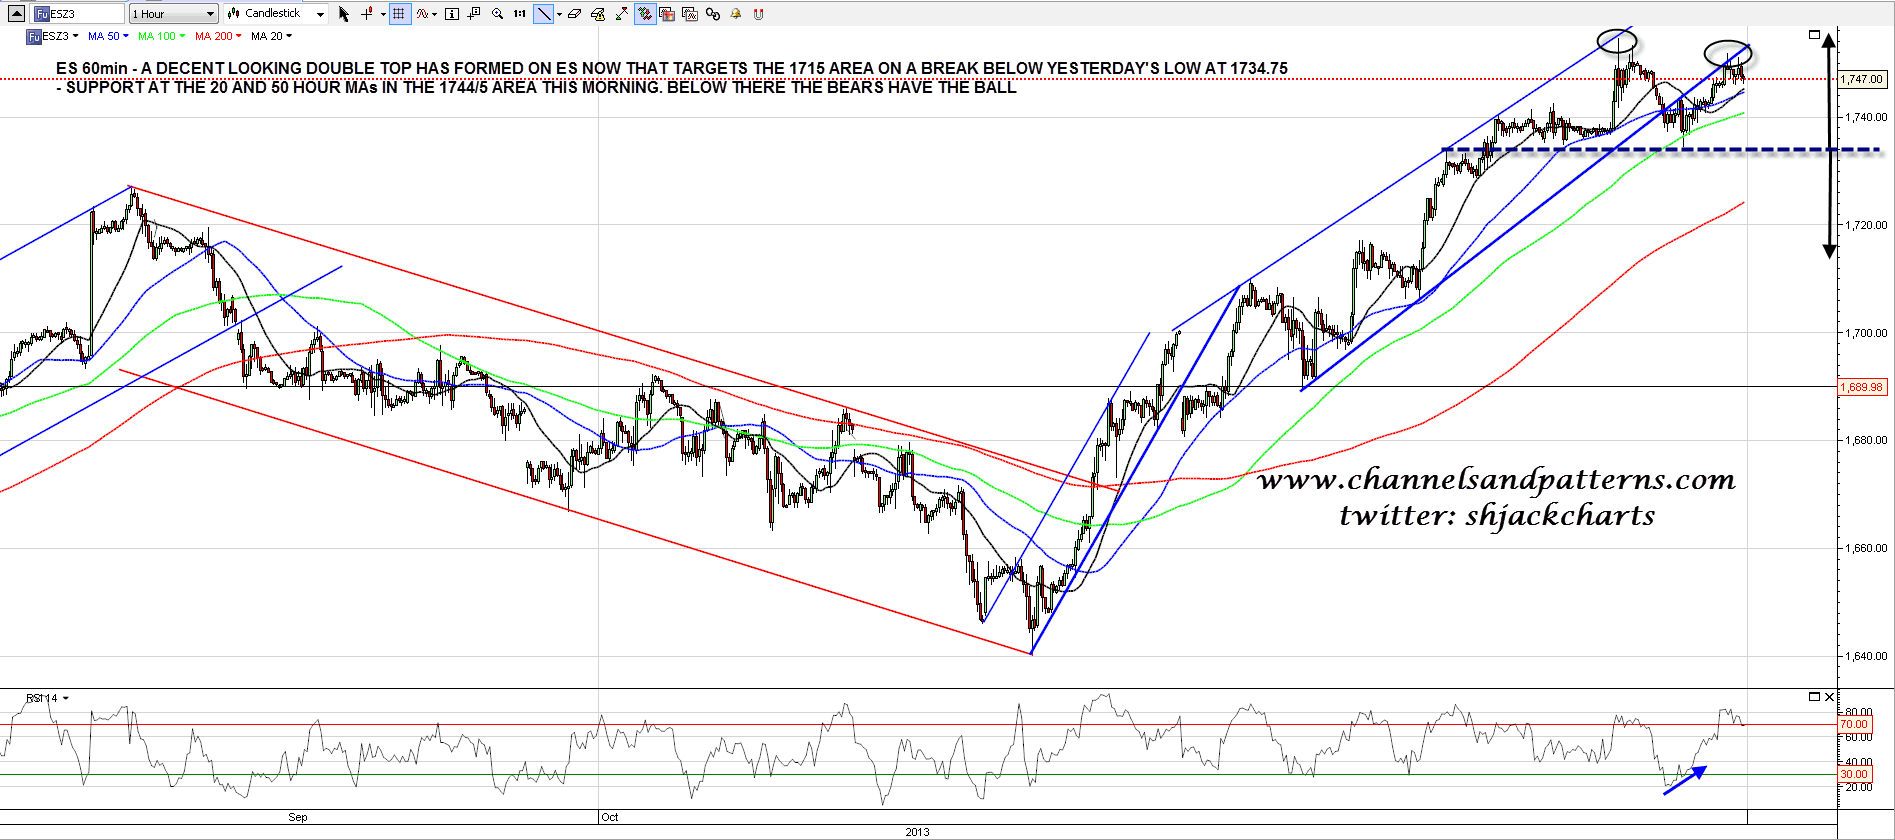
What had disconcerted me on the ES 60min chart chart was the positive RSI divergence at yesterday’s low and the very nice looking double-bottom targeting 1752 on a break over 1744. When ES broke over 1744 I mentally wrote off the H&S on SPX but as it happened ES went to 1751.75 and then gave most of the overnight gains back, having worked off the RSI divergence with that move. I have support at the 20 and 50 hour MAs in the 1744/5 area, which is being tested at the moment, and if the bears break back below that and stay below then they will have the technical advantage today. If ES can’t break back below then a retest of the current highs won’t be far away. Below 1744/5 however there is now a nicely formed double-top on ES targeting the 1715 area on a break below yesterday’s low at 1734.75. ES 60min chart:
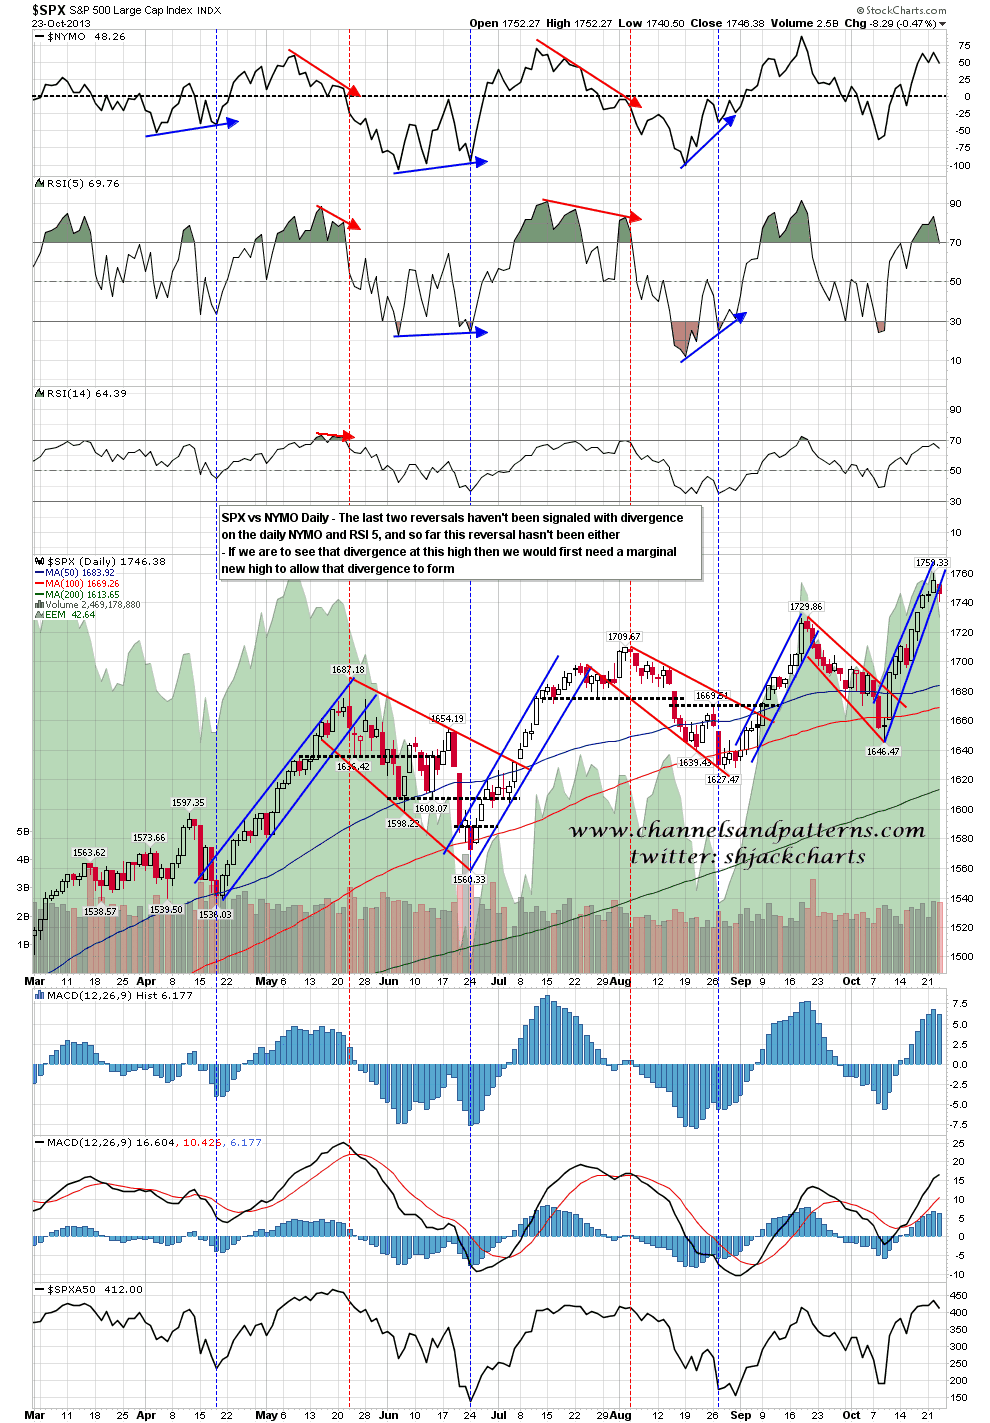
What I don’t see here is the divergences that I would usually see on the SPX daily chart at a significant high or low and those divergences are on the daily NYMO and SPX RSI 5 shown over the last few months on the chart below. SPX would need to make a marginal new high to establish those but they aren’t a requirement. As reversals get small these divergences also become rarer, and the retracement I am expecting here would be smaller than any shown on this chart with a signal. SPX daily chart vs NYMO:
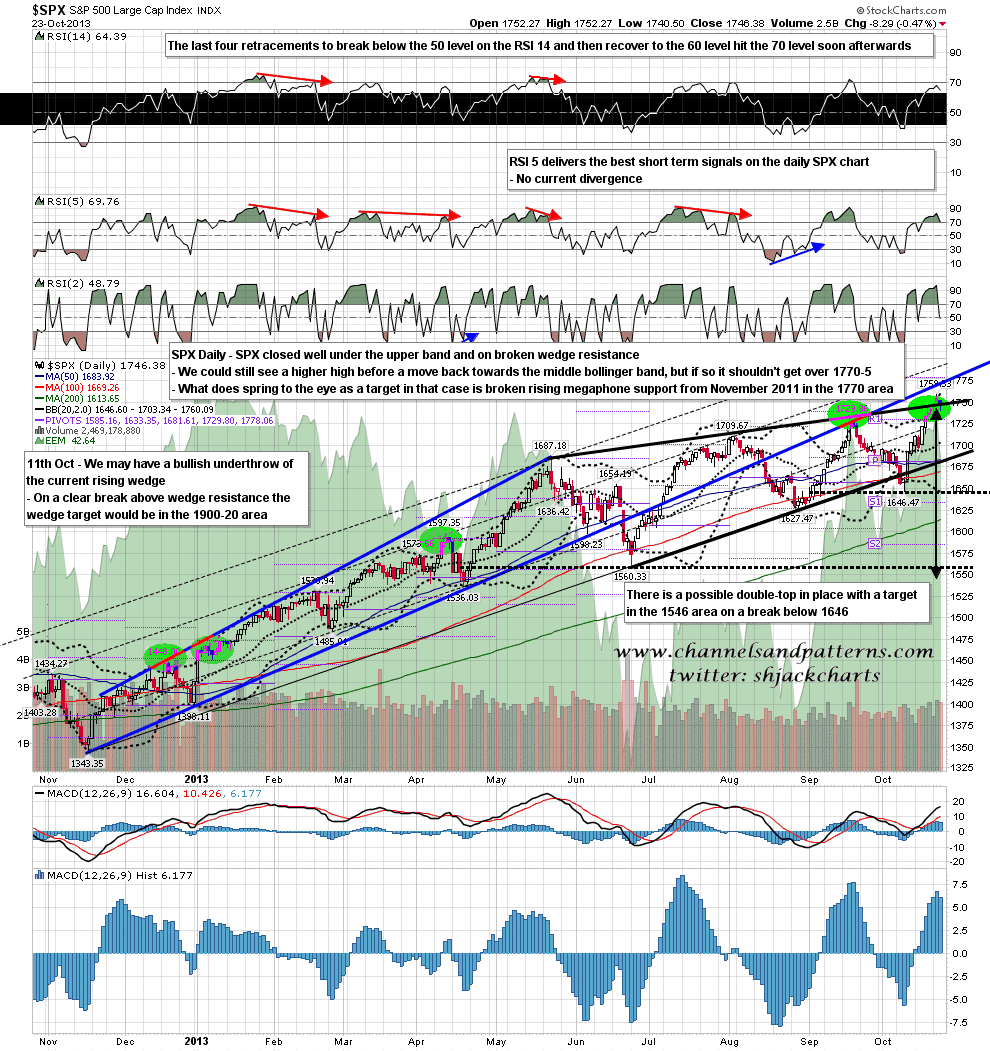
On my main SPX daily chart the close today was well below the daily upper bollinger band but that doesn’t preclude a marginal new high before an attempt to test the daily middle bollinger band. If we see the current high taken out the obvious target would be another retest of broken rising megaphone support from the November 2012 low, and that would currently be in the 1770 SPX area. SPX daily chart:
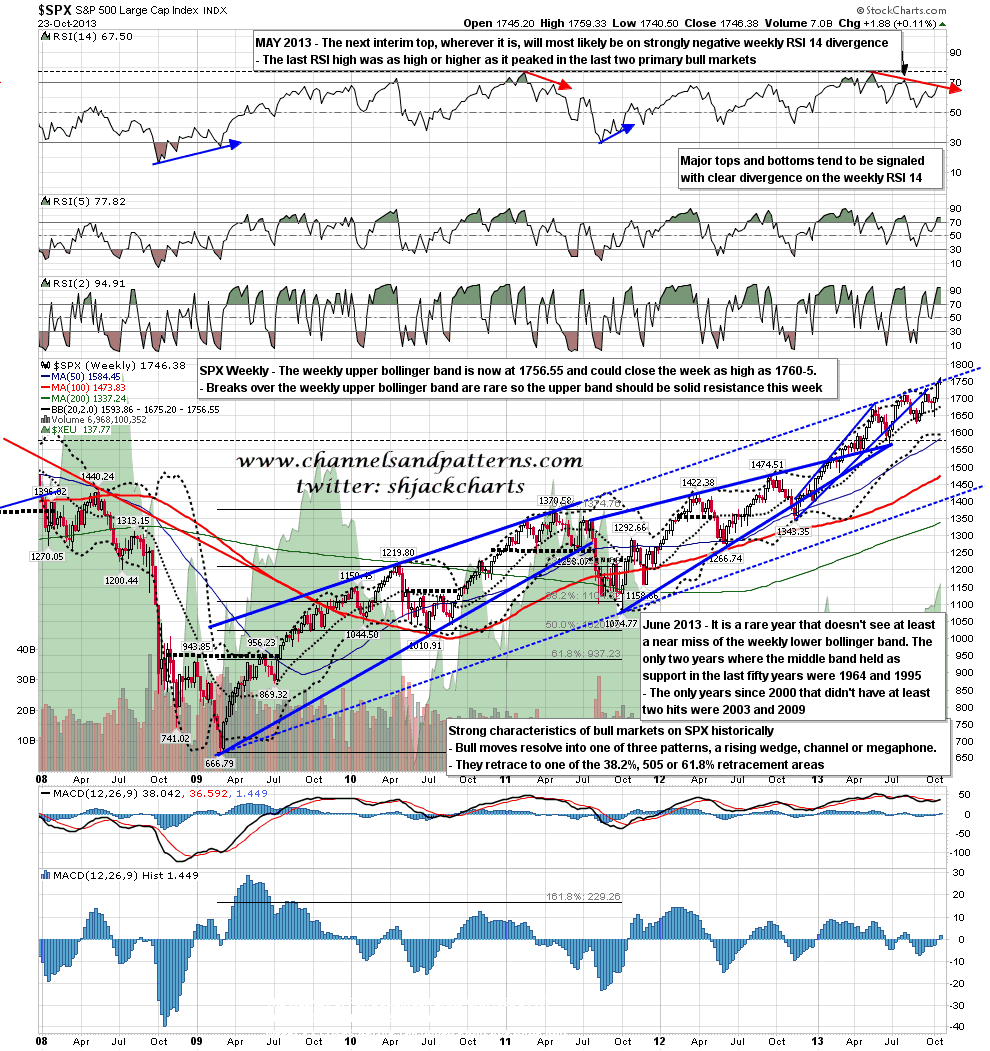
If we were to see a marginal new high then it’s worth noting that the weekly upper BB is now at 1756.55 and could close the week in the 1760 to (at a stretch) 1765 area. Breaks over the weekly upper band are rare, and generally signal significant highs, so I’m not expecting a weekly close tomorrow to be significantly above that this week. SPX weekly chart:
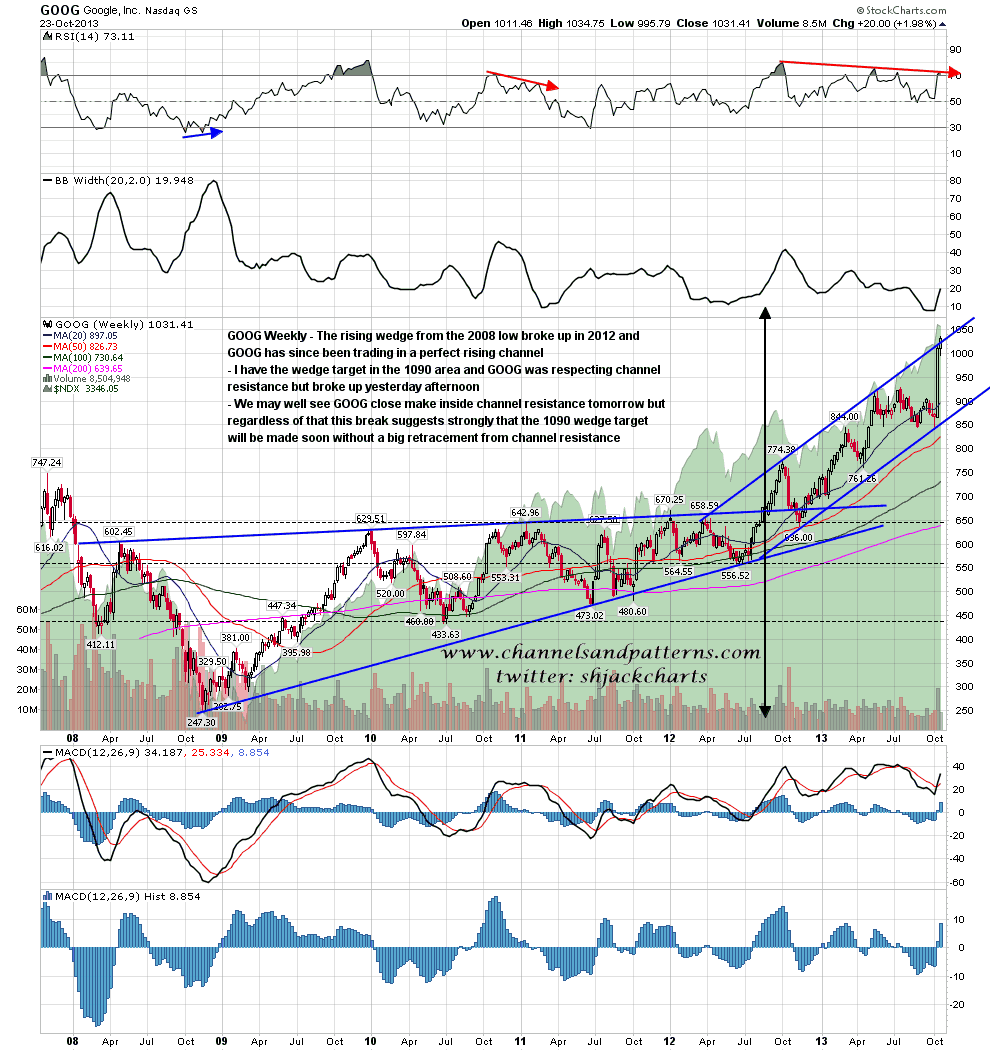
I’ve read quite a few comments about the recent spike up on GOOG having been a big TA fail, and after looking at my GOOG charts I entirely disagree and am planning a weekend post showing why this was very much a failure of weak analysis rather than TA as a tool. While I was looking at that I posted a chart on twitter yesterday showing the open wedge target at 1090 and the current rising channel where channel resistance was being tested. After that GOOG surprised me by breaking channel resistance. I’m posting this chart to say that the 1090 target may well be made soon, and that while we may well see GOOG close the week back inside the channel, the break yesterday suggests strongly that GOOG will make the 1090 target without a big retracement beforehand. GOOG weekly chart:
The bull/bear line couldn’t be much clearer on ES this morning and it is at 1744/5. Below that the SPX H&S and ES double-top are in play and I’d expect to see both break down today. Above 1744/5 ES I’ll be looking for at least a test of the highs and most likely a higher high in the next few days in the 1765-75 area. I’m leaning towards the first scenario at the moment but it could very much go either way.
