
The main ES contract has moved from December to March today and ES (March) is trading 6.25 handles below SPX, which needs to be borne in mind when looking at ES prices.
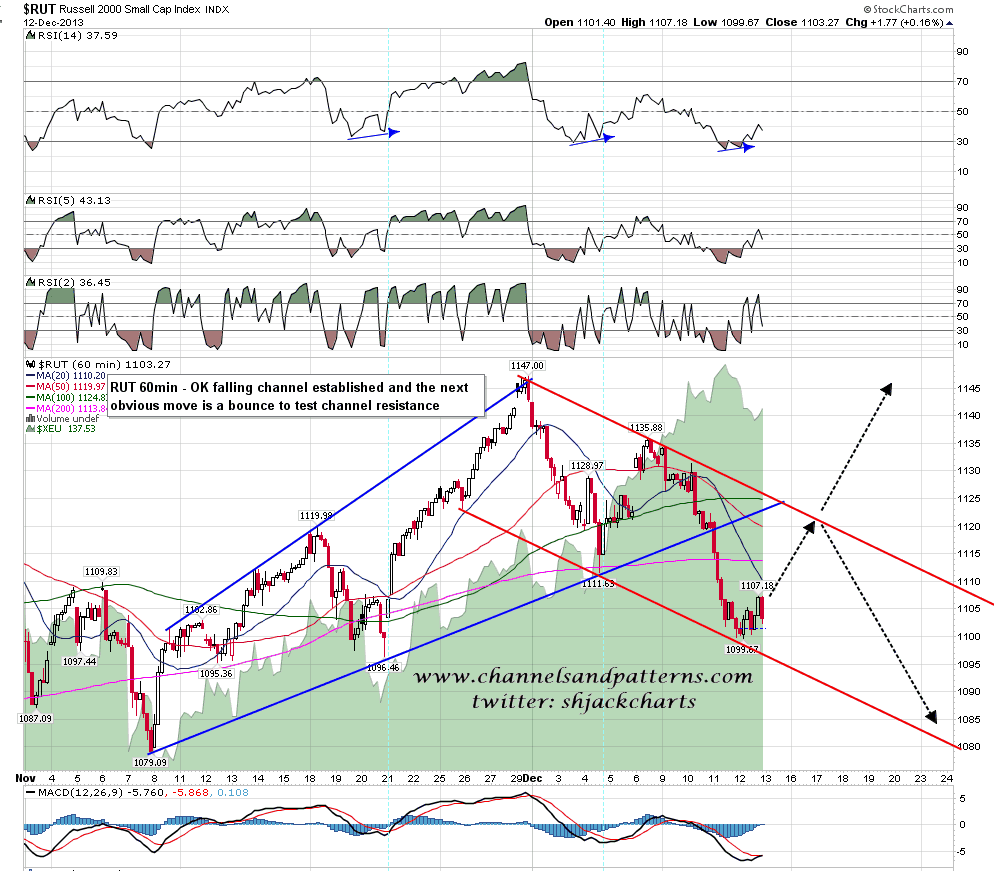
Yesterday’s close was a cliffhanger, with strong short term bull and bear scenarios that I posted on twitter and was thinking might well be resolved at the open. The bull scenario that I posted yesterday night on twitter was the declining channel on RUT, with the obvious next move being a bounce towards channel resistance, at which point RUT would either break up or turn back down. RUT 60min chart:
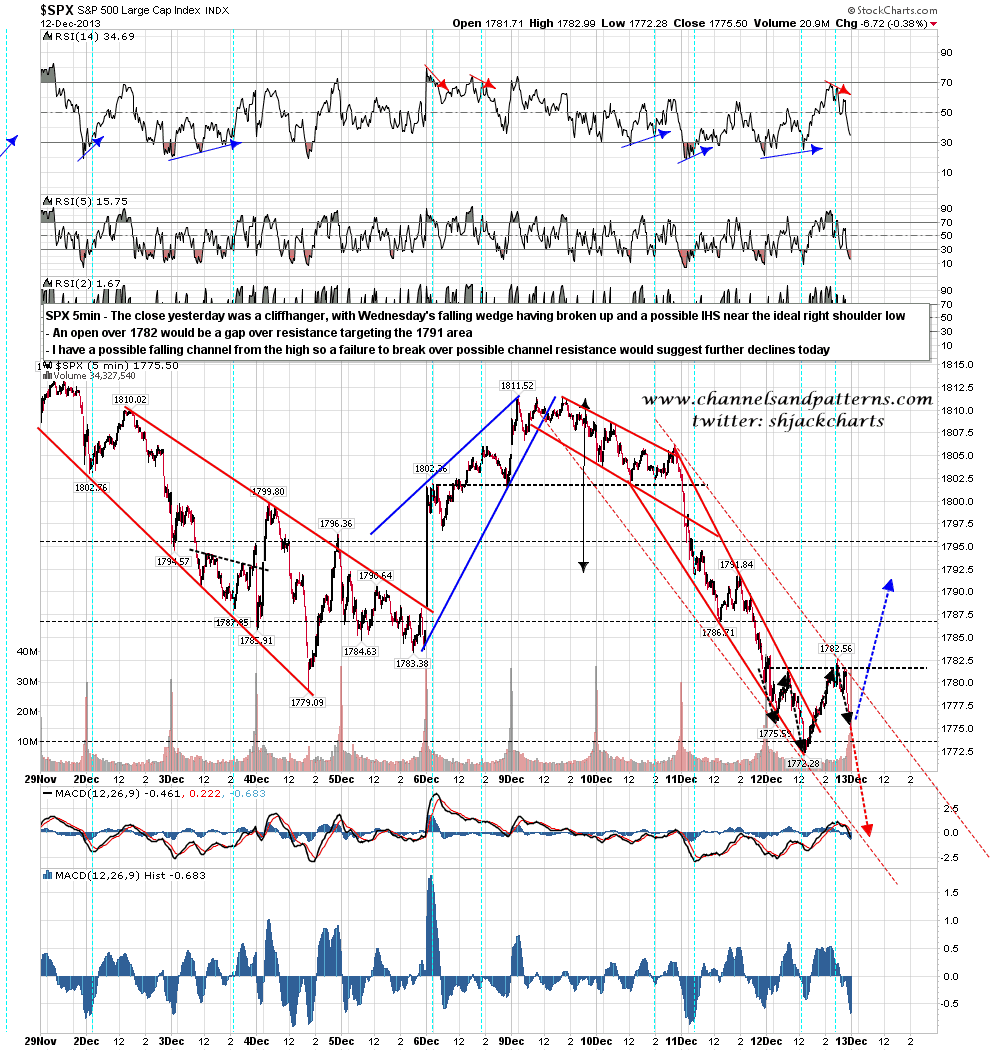
The equivalent of this bull setup on the SPX 5min chart is the falling wedge that I posted on twitter yesterday before and after it broke up, and the possible IHS forming after the initial rally from the wedge break. The close yesterday was close to the ideal right shoulder low on that IHS and an open over 1782 would be a gap up over resistance targeting the 1791 area. SPX 5min chart:
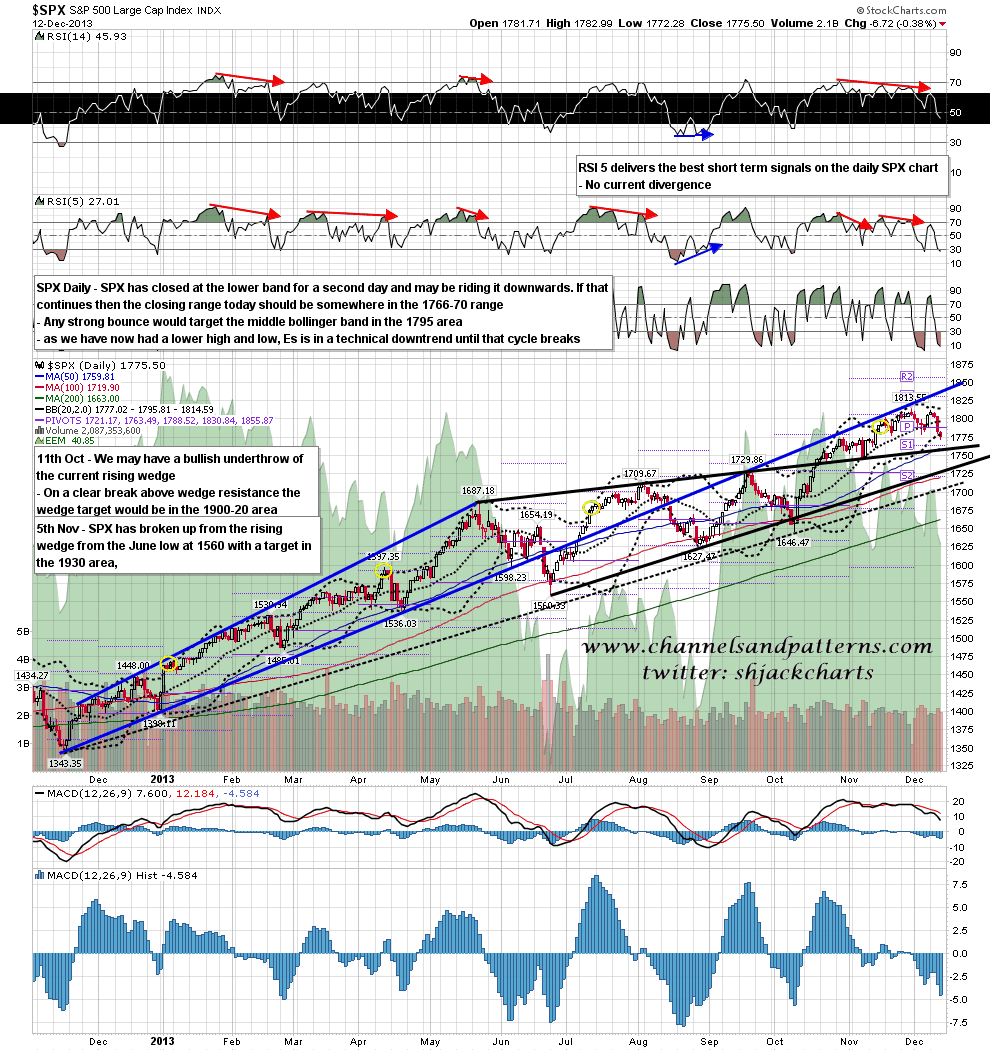
If we do see that IHS rally on SPX today the obvious upside target is the daily middle bollinger band, which closed at 1795 yesterday. SPX closed at the lower bollinger band for the second day yesterday and if SPX continues downwards I have an ideal closing range in the 1766-70 area today. SPX daily chart:
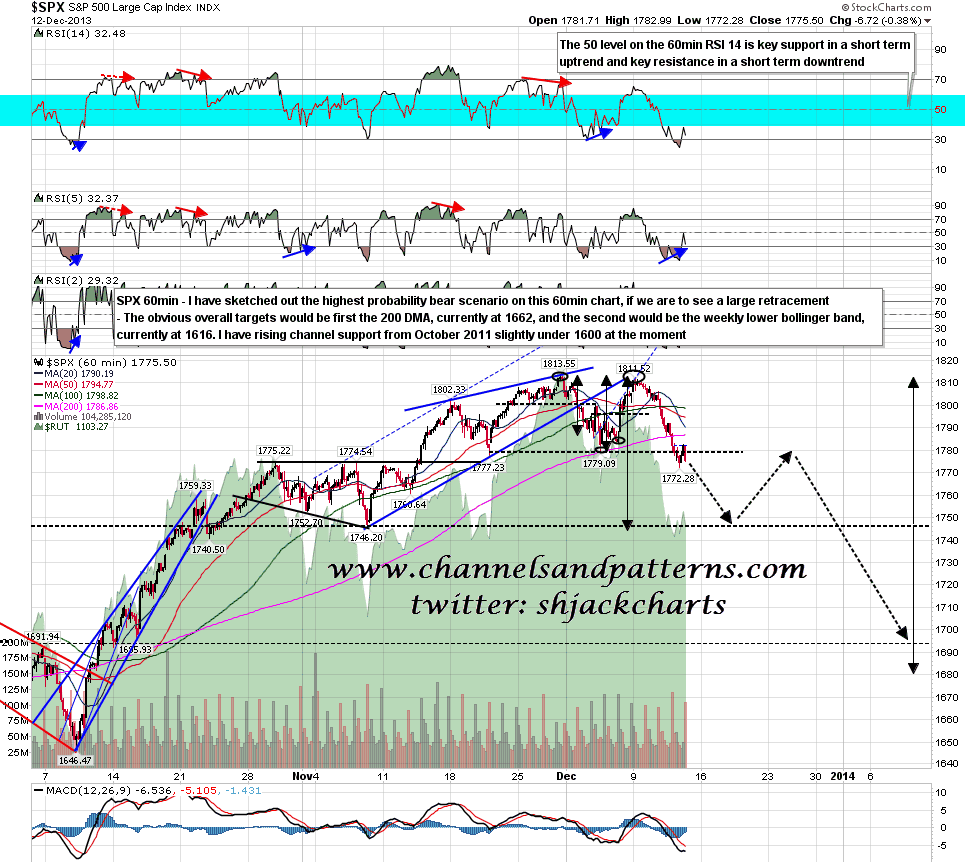
The bear scenario that I posted last night on twitter is of course the double-top on SPX that broke below the trigger level yesterday morning and is targeting the mid-1740s and the possible large H&S neckline there. These patterns, when they fail, tend to fail just under the break and yesterday’s low would be in that area. A move into the 1760s today would firm up this target. I have seen this viewed as an H&S around the blogosphere but the right shoulder and head highs are too close, so it is better viewed as a double-top. SPX 60min chart:
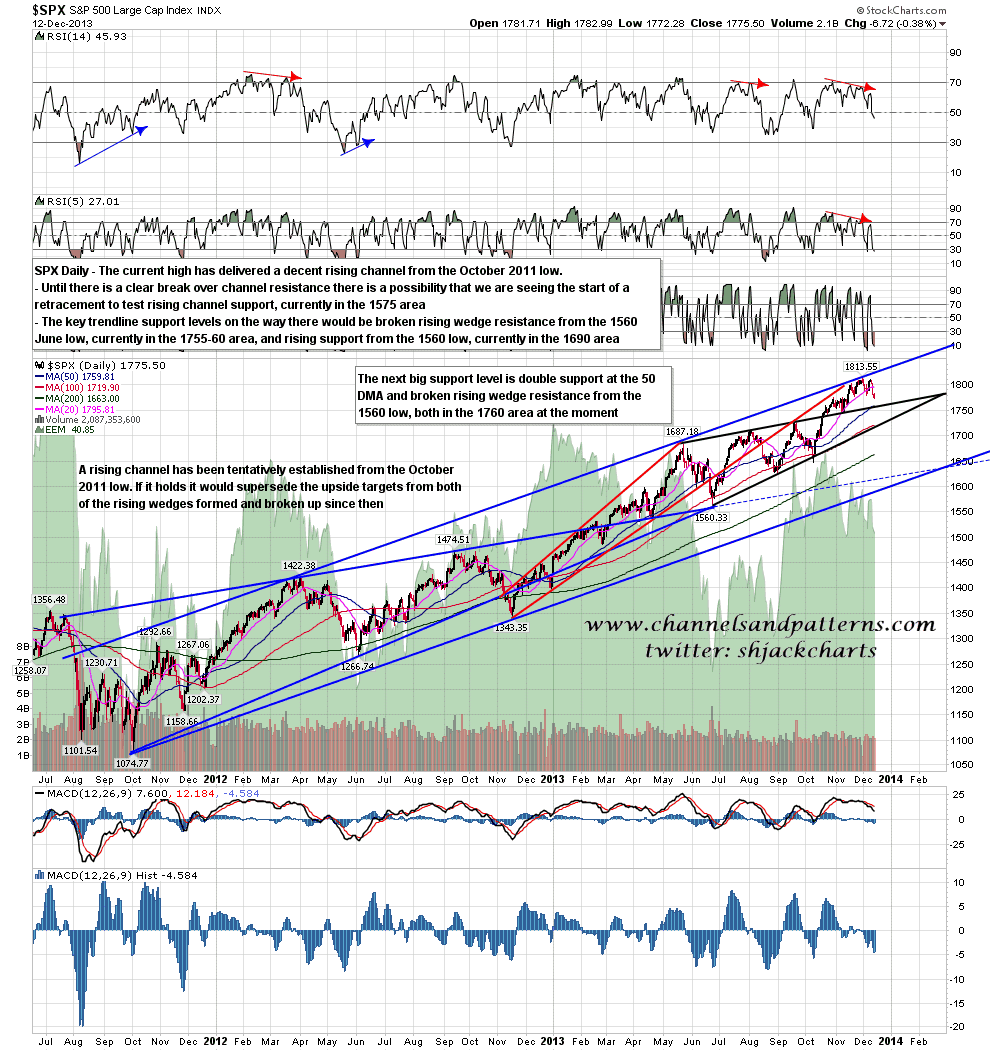
If this inflection point does resolve downwards then on the way to the 1740s target there is a very significant double support level in the 1760 SPX area, and that is where the 50 DMA meets broken rising wedge resistance from the 1560 low. This is an important technical support level that the bears need to break to firm up the overall bear scenario and I’ll be watching it carefully if it is reached. SPX daily chart from October 2011:
I would note that on the 5min chart ES has made a higher low and high overnight so until the overnight low at 1667 is taken out ES is in a short term technical uptrend. If that low is taken out we will most likely resolve down today with the next big support level in the 1760 SPX area in possible range today but more likely to be tested on Monday. The level to take out on the upside is at 1777.75 ES, which was the high yesterday, and if that’s exceeded then I’ll be looking for that test of the daily middle bollinger band on SPX and ES. No time for other markets today. I’ll be posting some charts for these on twitter after the open.
