
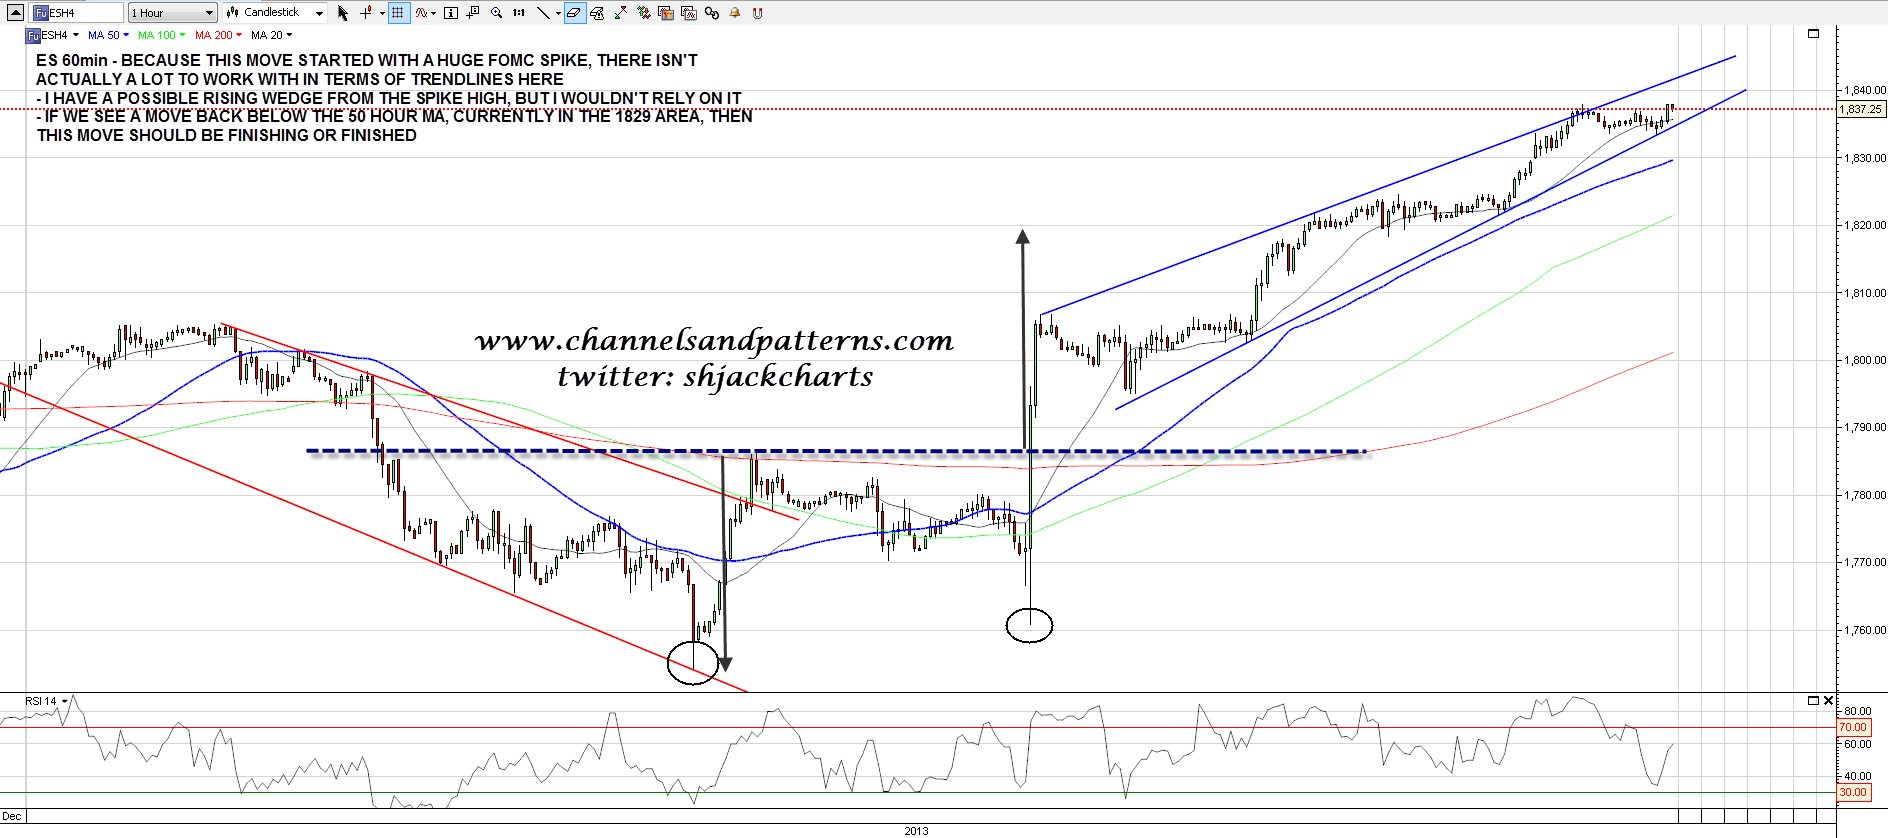
This move up from the Fed spike up has been an inexorable grind. Due to the way it started there are no really decent trendlines in play here from the last low, and so no real patterns either. In effect we just need this wave up to blow itself out, and the next high and low should start to give some shape to the current overall move. On ES I have a three touch support trendline that may or may not be of much use, but the best signal that the current uptrend has ended will most likely come from a break below the 50 hour MA, currently in the 1829 area. ES 60min chart:
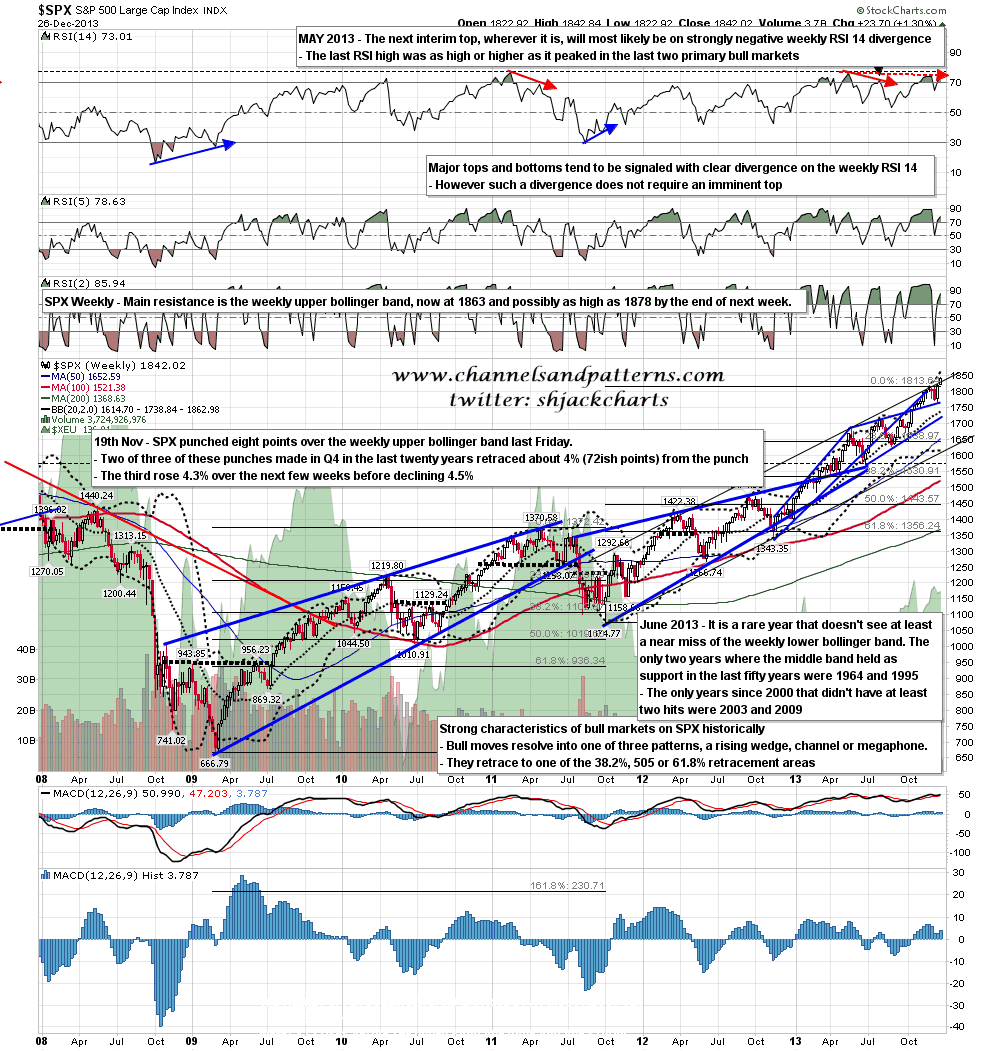
Main resistance overhead is at the weekly upper bollinger band, and that’s at 1862, but I’d be surprised to see that hit on the current move, particularly as that should close next week in the 1875-80 area. SPX weekly chart:
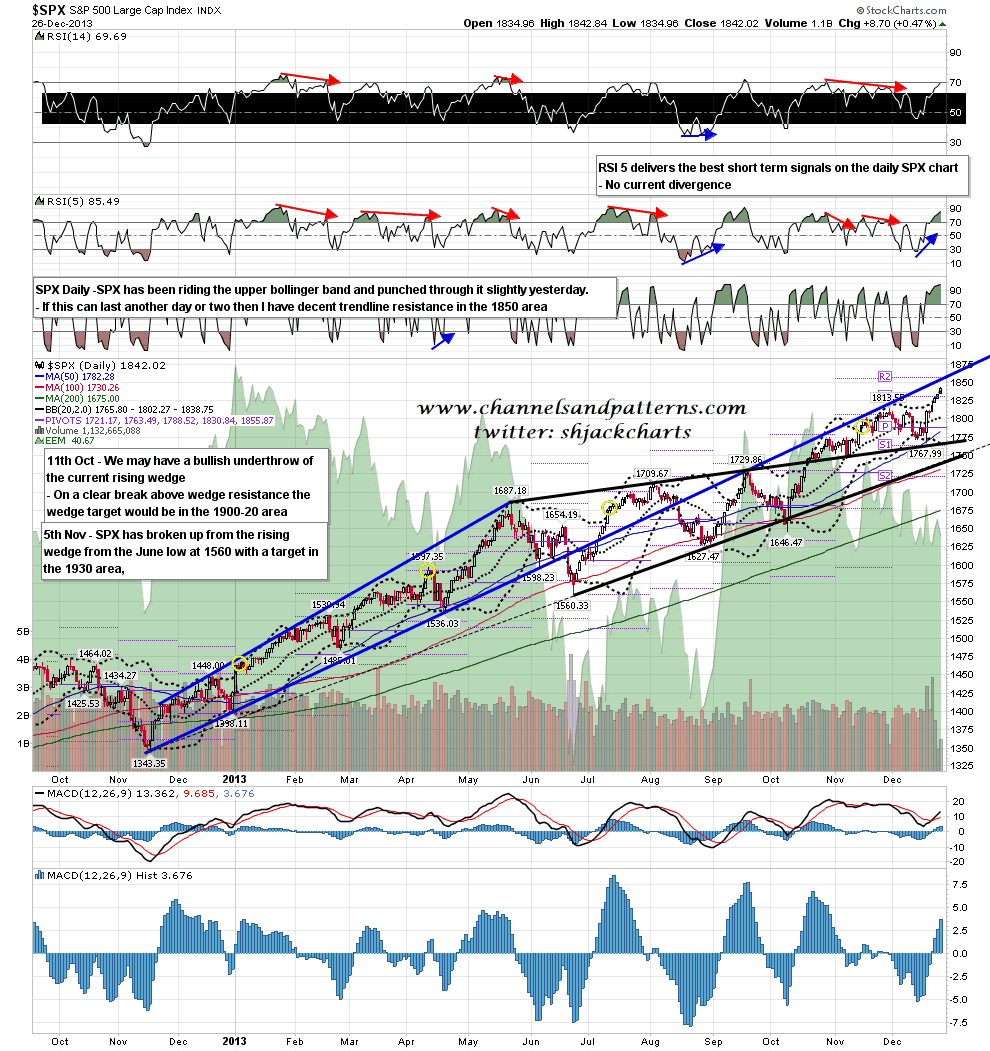
I do have one decent resistance trendline overhead that may hold, and that is broken rising megaphone support from earlier this year. That has held since the last break below it in August and is currently in the 1850 area. On this daily chart SPX has been riding the daily upper bollinger band up and punched above it slightly at the close yesterday. This suggests that we may see an interim high within a day or two. SPX daily chart:
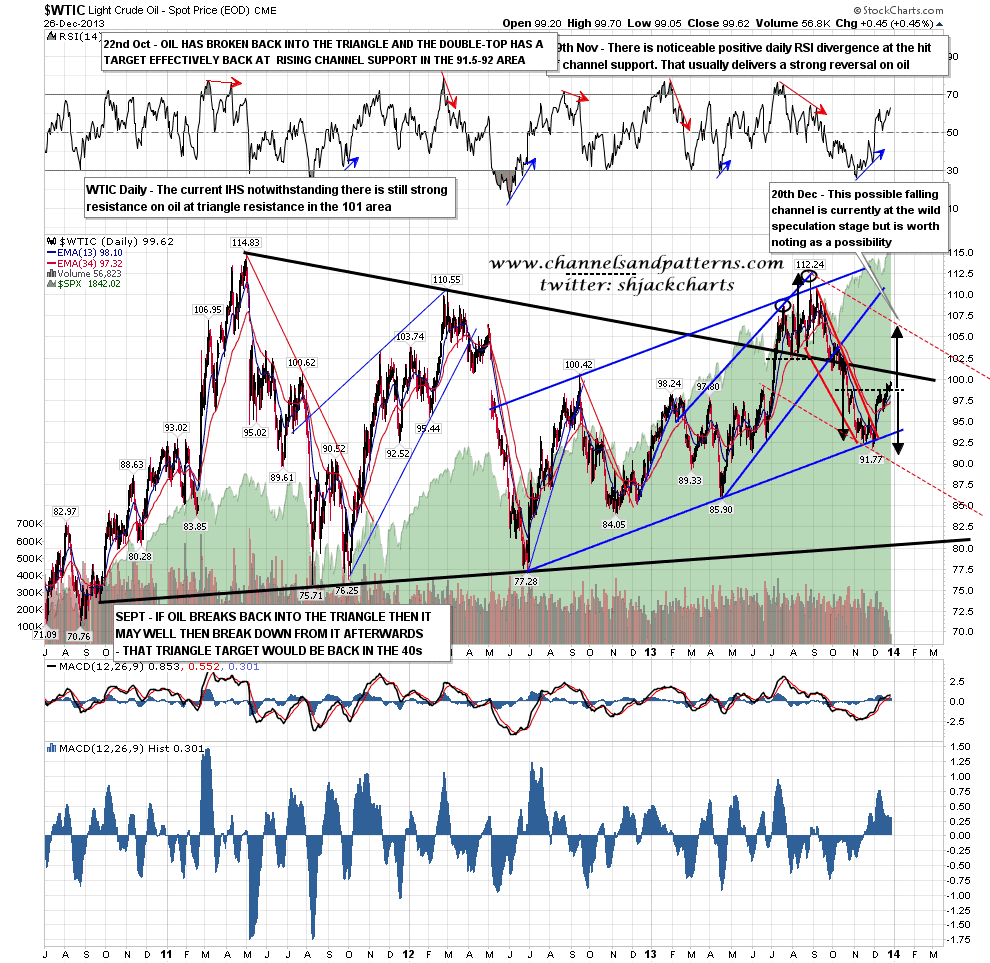
Last chart for today is WTIC, where oil is now breaking above the IHS neckline. The IHS target is in the 106 to 106.5 area and as I have mentioned before, there is significant resistance in the 101 area at multi-year triangle resistance. WTIC daily chart:
Sometime in the next few days this wave up should blow out and we will see a decent retracement. Apart from some overhead resistance in the 1850 SPX area however there are no decent trendlines or pattern setups here, and unless we see a decent topping pattern form it’s hard to see much appeal in trying to catch this next high. When we see that retracement I’d expect a decent retracement pattern to form and at the bottom of that retracement will be a very attractive buying opportunity into my main Spring high target in the 1965 area. Until that retracement begins however there’s not much to see.
