
Well I’ve been saying all week that I would start to take the larger bear scenario here seriously on a break below the weekly pivot at 1796, and here we are. Who knew that the bears had it in them to deliver a full day of relentless selling? It’s been a while since we have seen that.
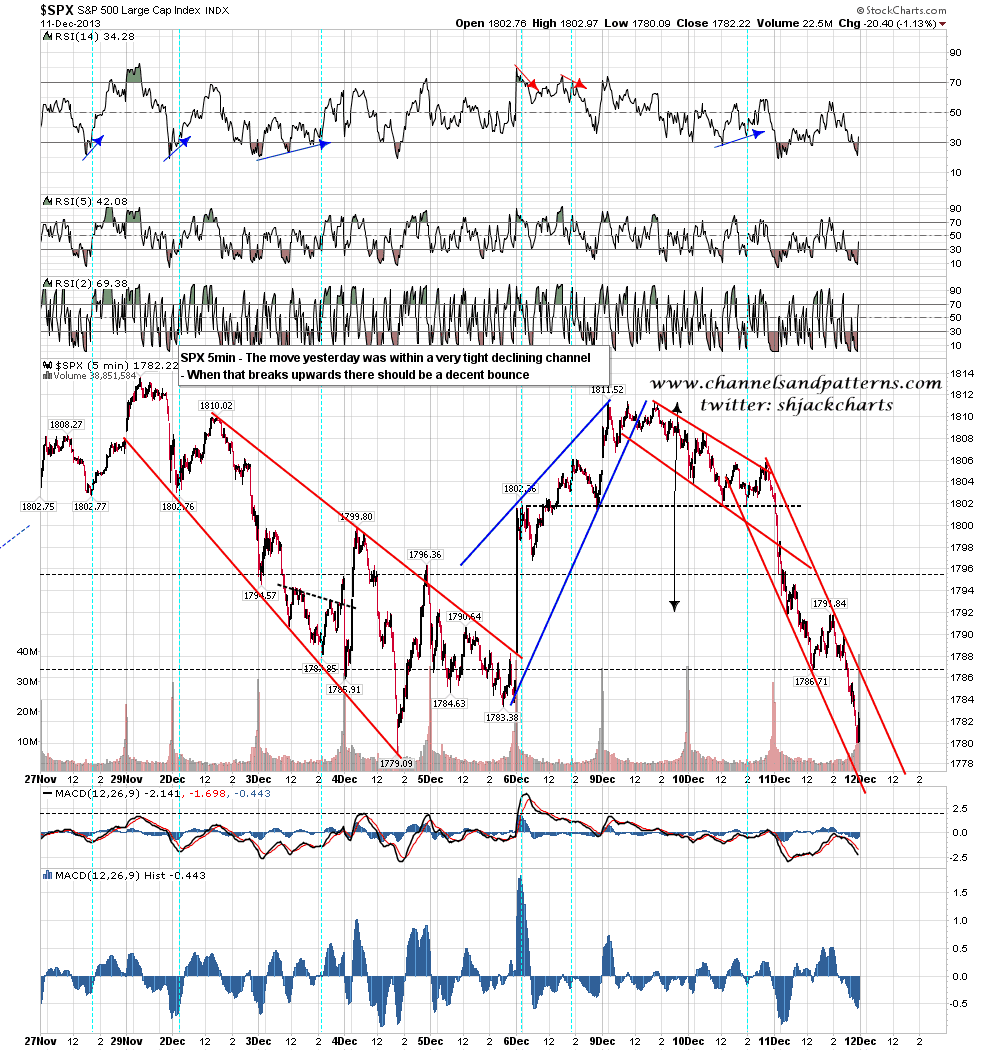
In the short term the decline on SPX yesterday was within a tight declining channel that was intact at the close. We may see that break up at the open and if so I’ll be looking for a short term low to form for a bounce. Until this channel breaks up however, we are in an established and very steep downtrend. SPX 5min chart:
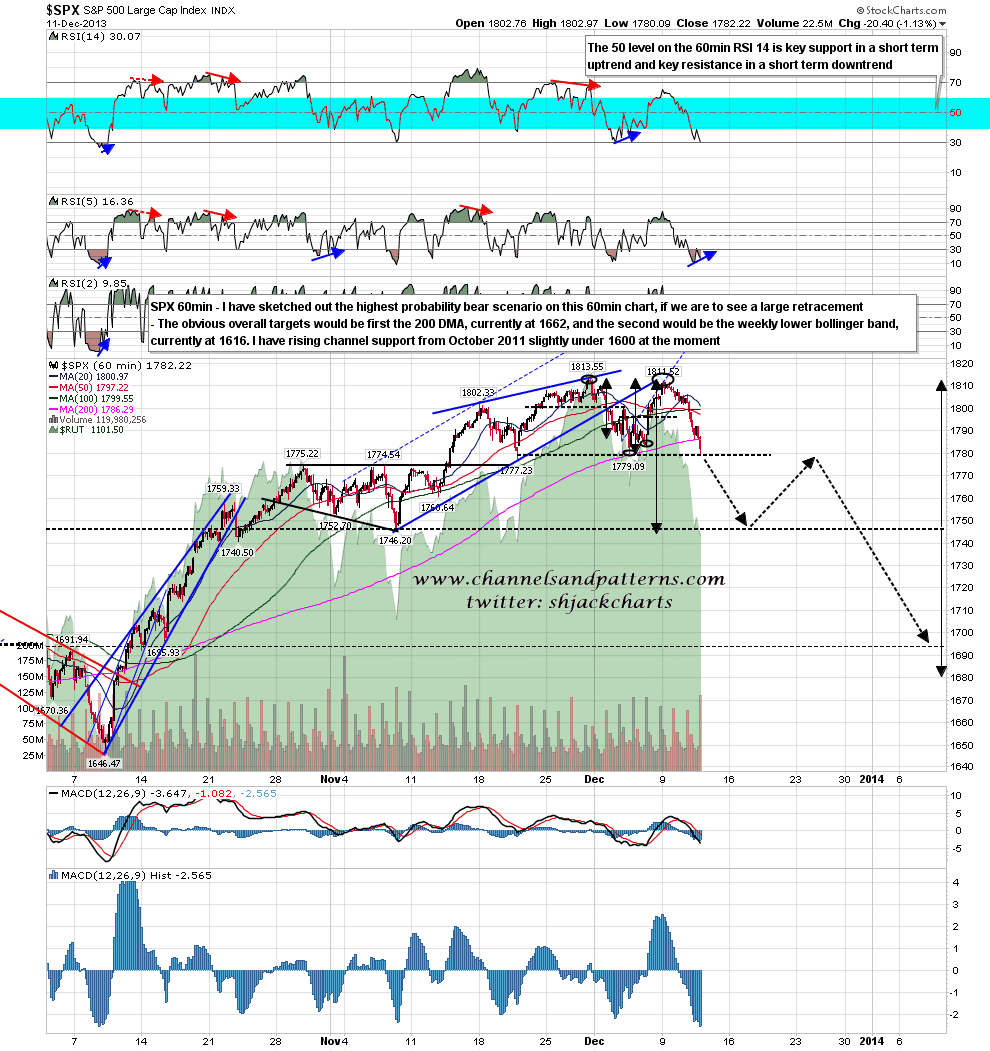
As the bears showed some real strength yesterday I’ll run through the overall bear setup here, and the highest probability path for a strong retracement from the recent highs if we are to see that. On the 60min chart below I have marked up the current double-top that has not not yet broken down but may do so today with a target back in the mid-1740s. If we see that then the obvious target is the possible H&S neckline there, and if we were then to see a right shoulder form to complete that pattern there would then be an H&S targeting the 1680 area. The obvious downside targets for a large retracement would be the SPX 200 DMA, currently at 1662, and the weekly lower bollinger band, currently at 1616. SPX 60min chart:
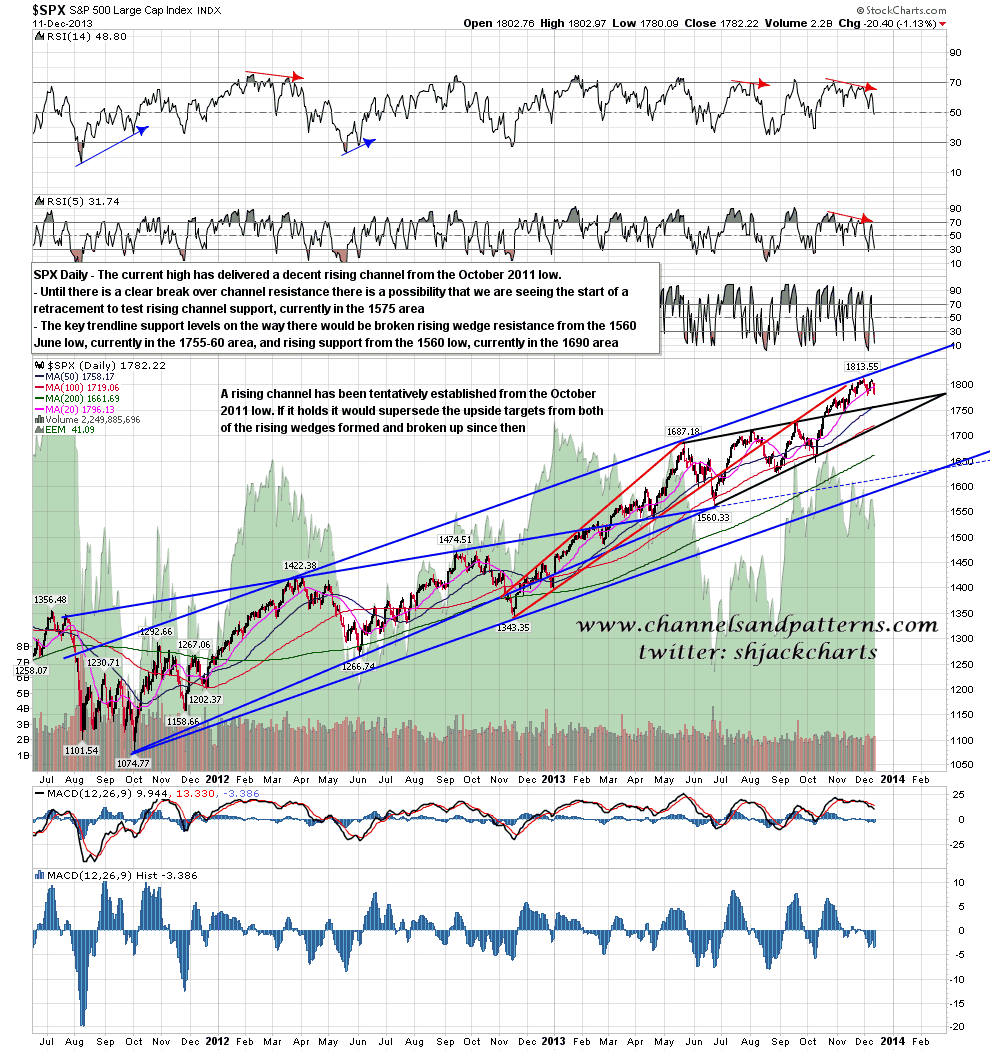
If we are to see that large retracement over the next few weeks and months, that would be in the context of a large rising channel from the October 2011 low that was established at the 1813 high. The channel target would be at rising channel support, currently a little under 1600 and not far from the weekly lower bollinger band. Important support levels to note on the way would be broken rising wedge resistance in the 1760 area and rising support from the 1560 area, currently in the 1690 area and a decent fit with my theoretical H&S target and the 200 DMA. SPX daily chart:
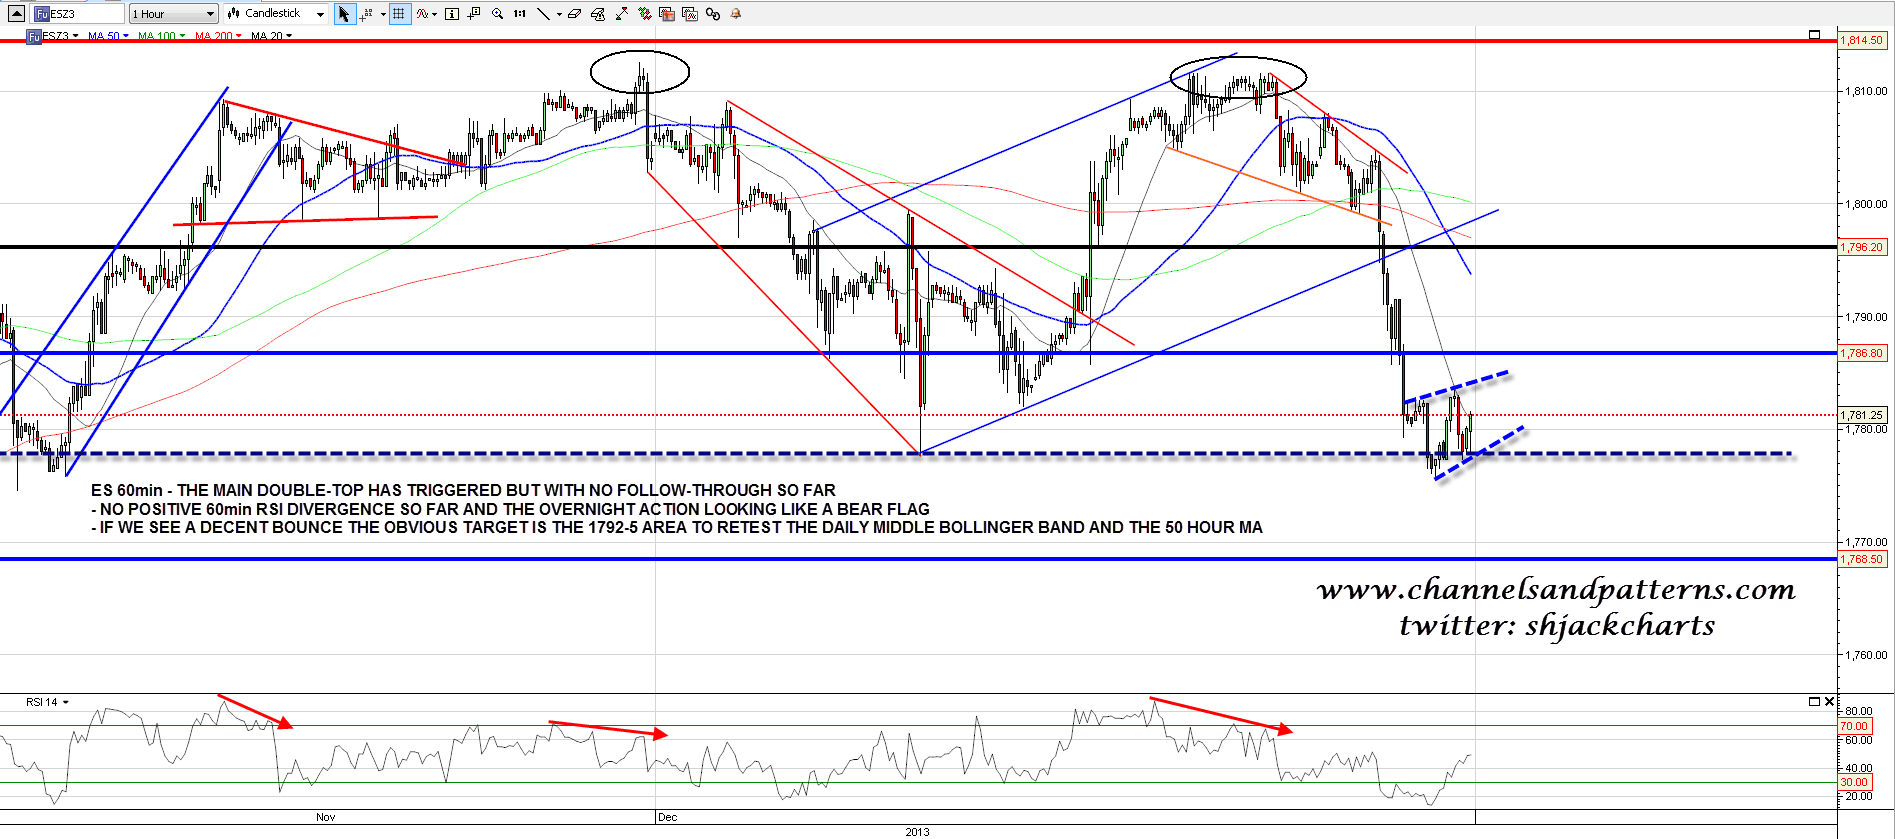
On ES the overnight action currently looks like a bear flag forming at the hit of the daily lower bollinger band, and there is currently no positive 60min RSI divergence. There’s nothing immediately obvious to suggest an imminent bounce though that possible bear flag might turn out to be a double-bottom. If we do see a bounce today the obvious target is the 1792-5 area to retest the daily middle bollinger band and the 50 hour MA. ES 60min chart:
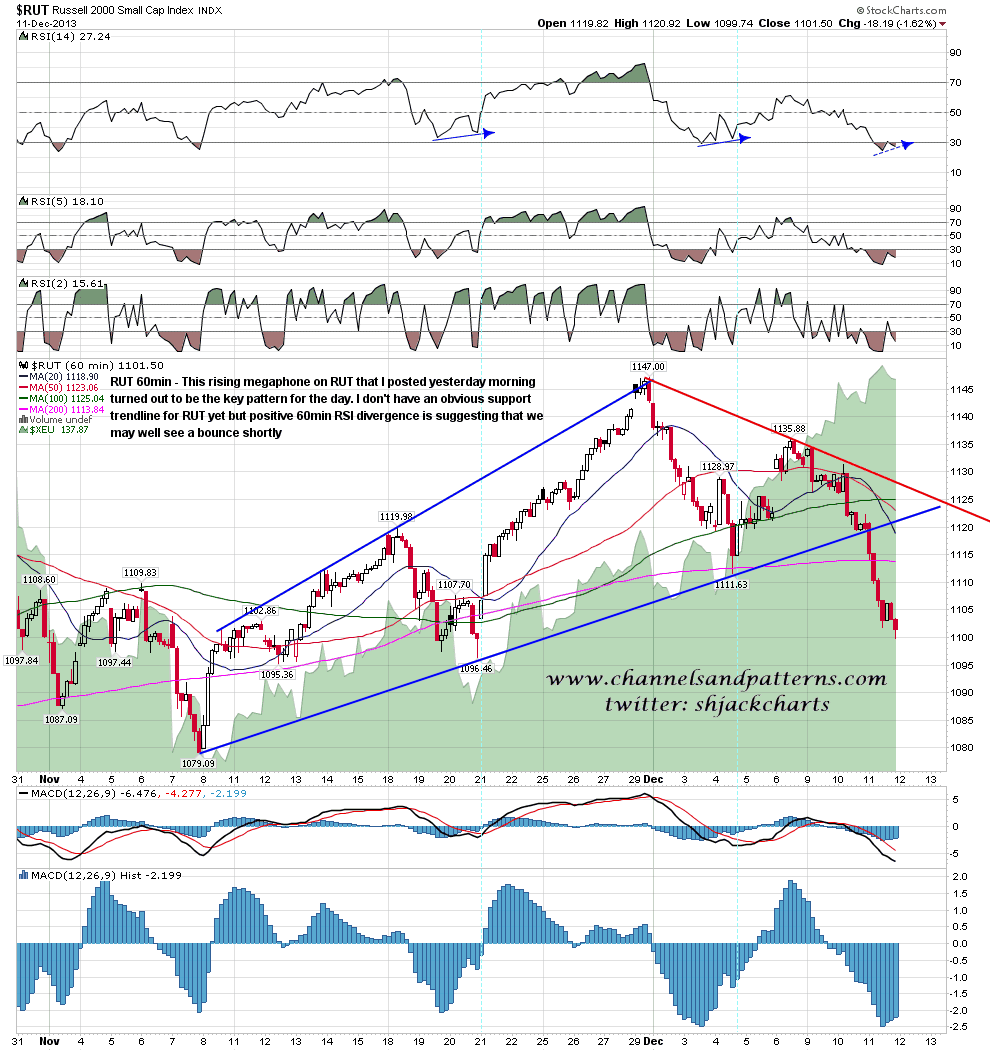
The rising megaphone on RUT that I posted yesterday morning turned out to be the key pattern of the day as equities melted down after that megaphone broke at the open. I don’t have a pattern for the decline yet but the positive divergence on the 60min RSI is suggesting that a bounce may be close. if we see that the obvious target would be declining resistance in the 1127 area. RUT 60min chart:
I’m looking for a bounce soon that would retest the middle bollinger band on ES and SPX in the mid-1790s. We may not necessarily see that but of the seven hits of the daily lower bollinger band from the upper bollinger band, all seven made a low within a day and then retested the middle band. Of those seven, five then returned to the upper bollinger band. That doesn’t mean we’ll definitely see a retest of the middle band here, but it would seem more likely than not that we will.
