
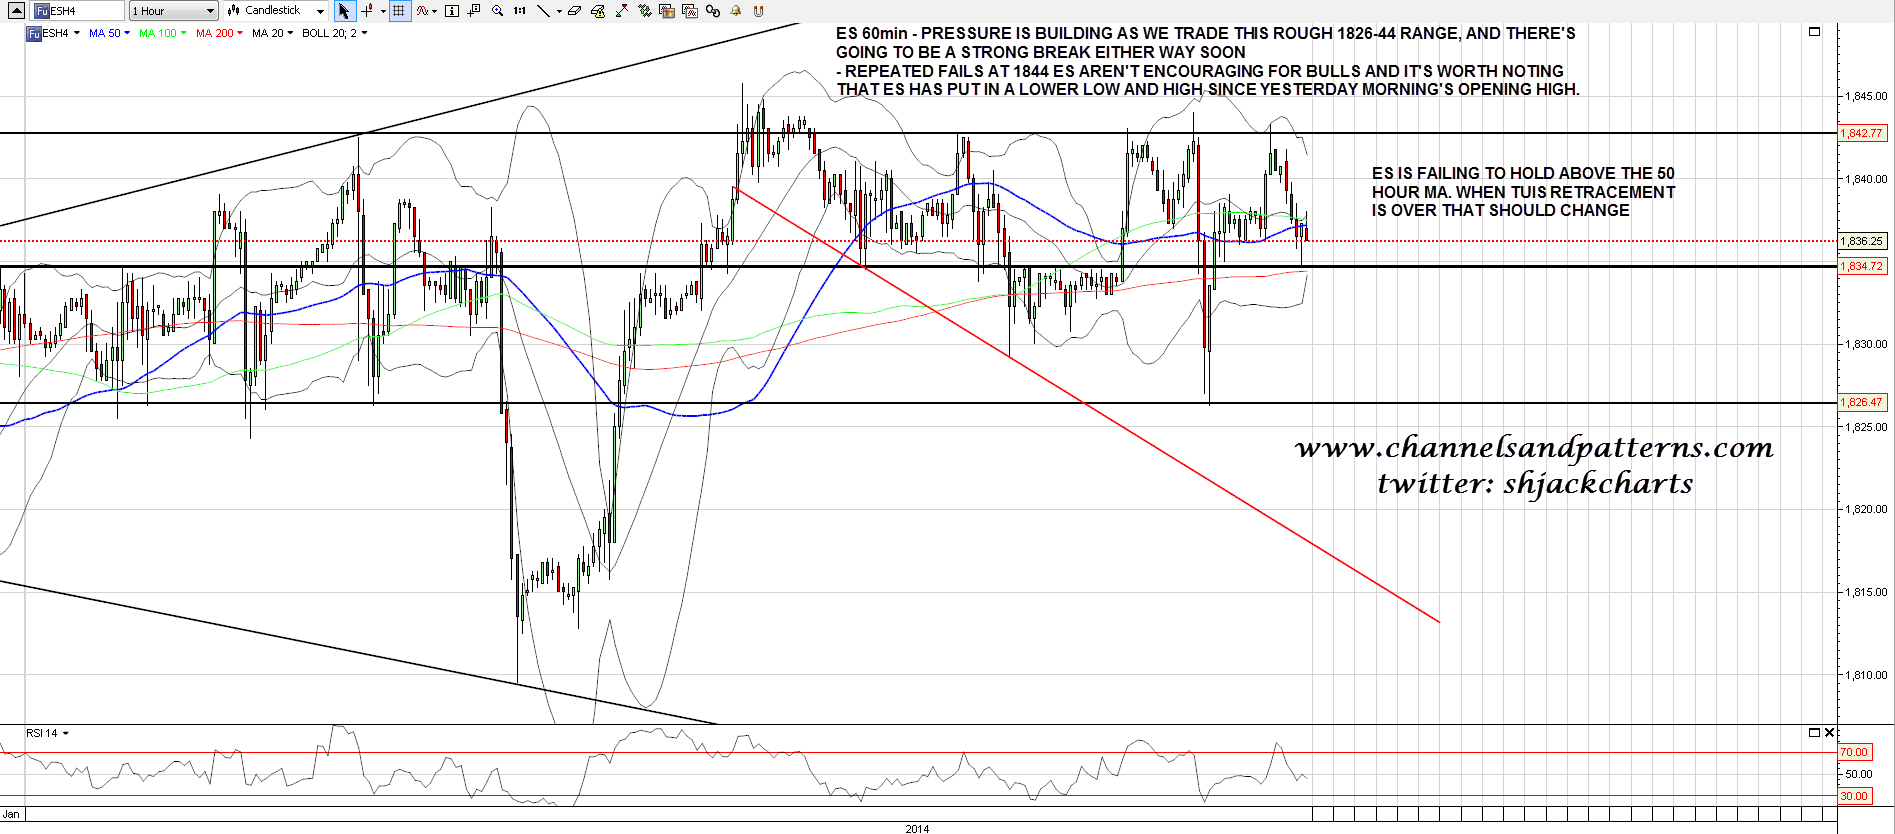
I was expecting SPX/ES to make a new high yesterday morning but it failed just underneath, which was a significant bull fail. ES then went to retest support in the 1826 area, breaking below the pattern trigger level on a small double-top targeting the 1815 ES area, but instead of following through on the break down ES then bounced strongly for the rest of the afternoon, which was a significant bear fail.
Bottom line is that ES is trading in a 1826-44 range, with a strong mid-level at 1835.Pressure is building and we will most likely see a breakout soon that should be followed through. ES 60min chart:
The main setup I’m watching here is the nested double-tops setup that I posted on twitter yesterday morning. If this breaks down again (and more durably) then the target is at 1820 SPX (1815 ES) where there is strong support from both the rising support trendline from 1646, and the daily lower bollinger band. This is also a bull setup on a break up of course as a failed break down will generally produce a strong reaction in the opposite direction. on a new high I’d be looking for a rough target in the 1865 area. SPX 60min chart:

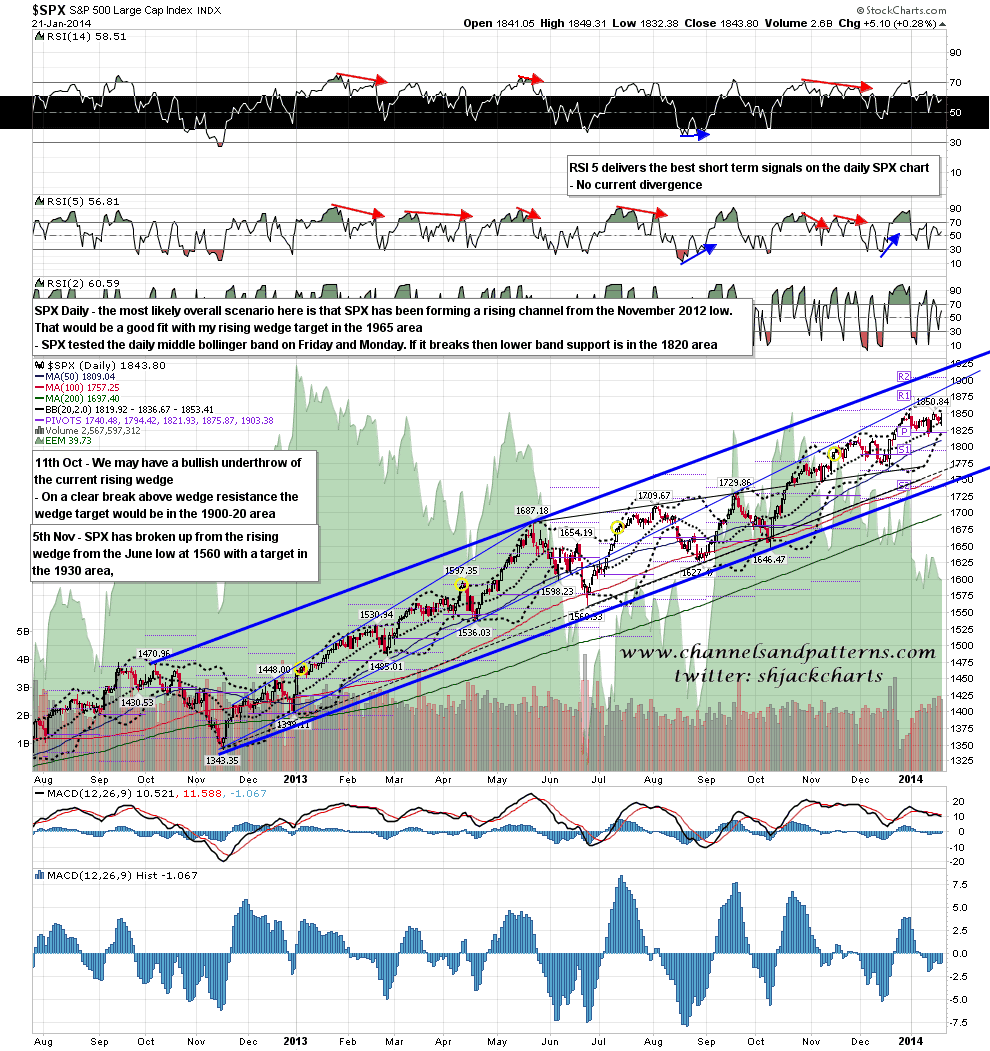
On the SPX daily chart I have middle bollinger band support in the 1837 area, with the lower band at 1820 and the upper band at 1853. The daily bollinger bands are pinching together tightly and this is suggesting a big move is coming. SPX daily chart:
On other markets TNX is still testing the neckline on the H&S that finished forming last week. TNX has made a marginal low on strongly positive RSI divergence and there is a possible double-bottom setup to return TNX to the highs if the H&S doesn’t break down. That would make more sense to me than a big decline in yields at this stage. Big declines in yields tend to happen at the end of QE periods for sure, but a 10% taper seems more like a rounding error than a major policy shift. TNX 60min chart:

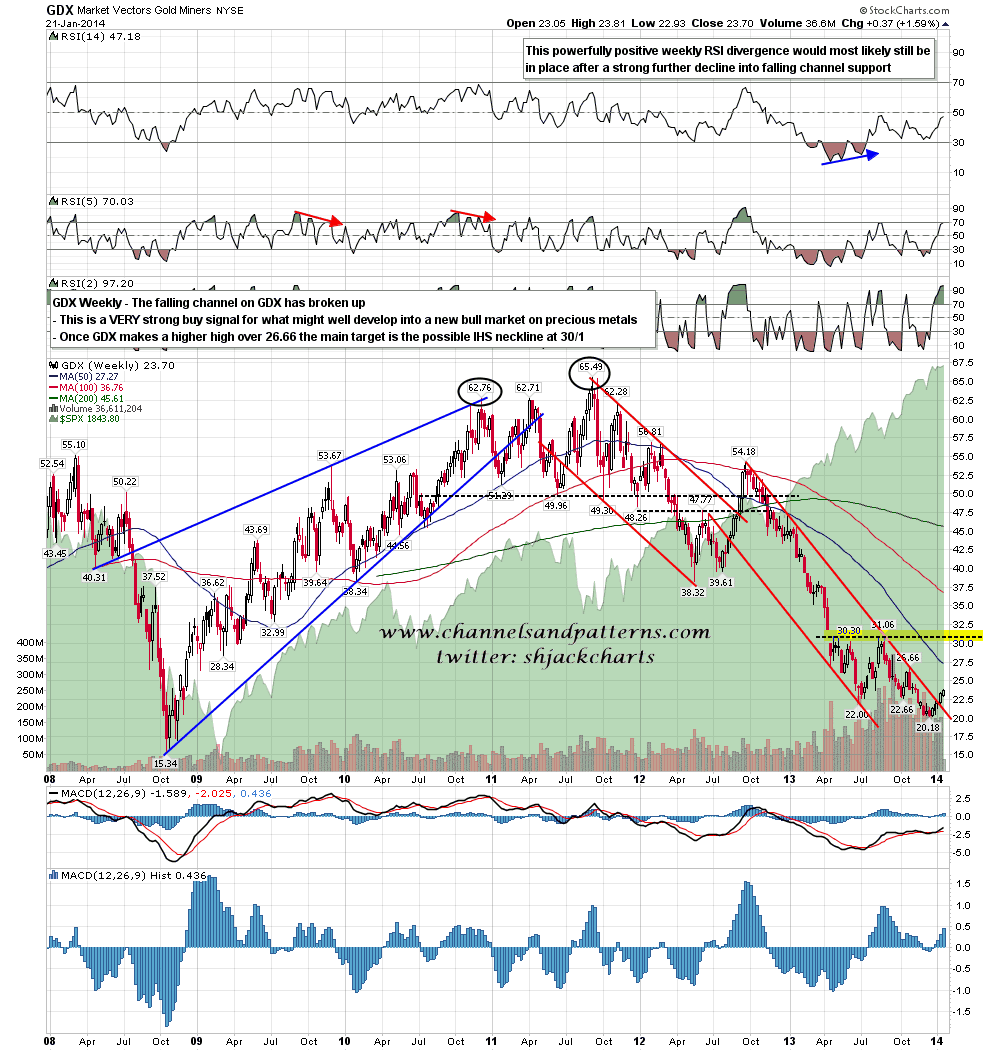
I showed the chart when GDX broke up from the falling channel last week. GDX has been building on those gains and after beating the last high at 26.66 the main target will be the possible IHS neckline at 30/1. As I mentioned last week, I have been looking for this break as a probably early indicator that the precious metals sector is bottoming out before the next big bull phase. I’ll keep you posted. GDX weekly chart:
I’m still leaning towards seeing a break up next on SPX rather than a break down, but the bears definitely became a more serious alternative yesterday. Until we have a break I have a two part range 1826-34, 1835-44. trade carefully until we break one way or the other.
