
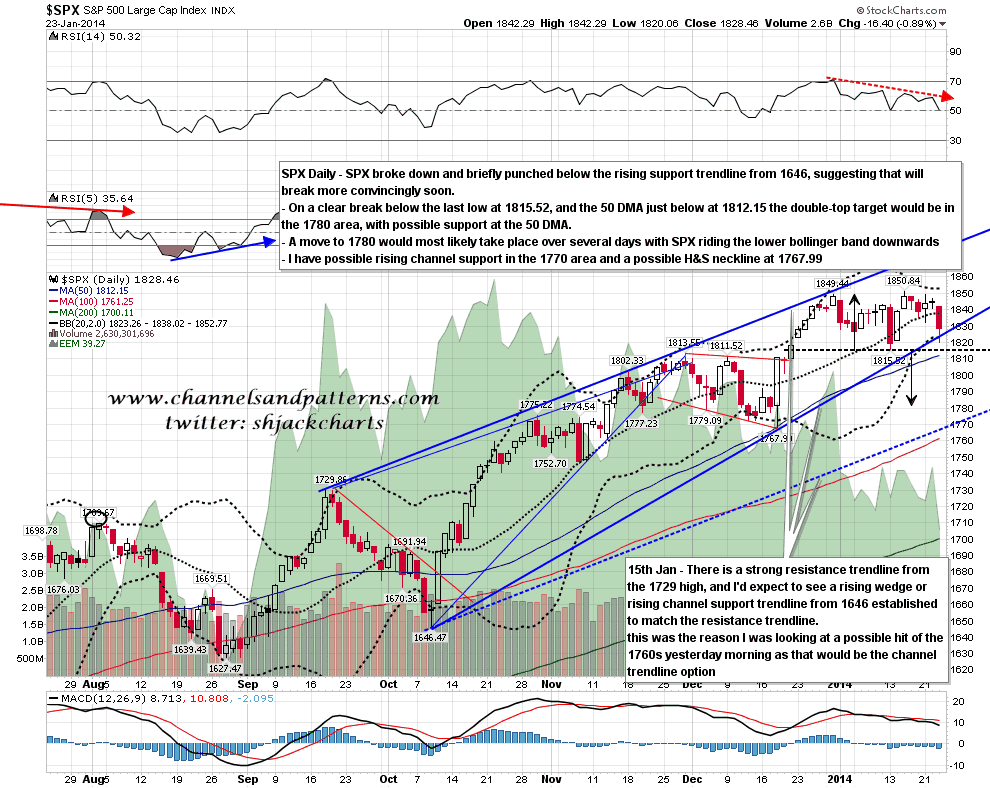
The SPX daily bollinger bands have narrowed considerably over the last few weeks, until yesterday morning there were less than thirty points between the upper and lower bands. This compression is a pinch, and these pinches will generally resolve into a move one way or the other that will ride the upper or lower band for several days. If the larger double-top on SPX breaks down today then that should play out to the downside.
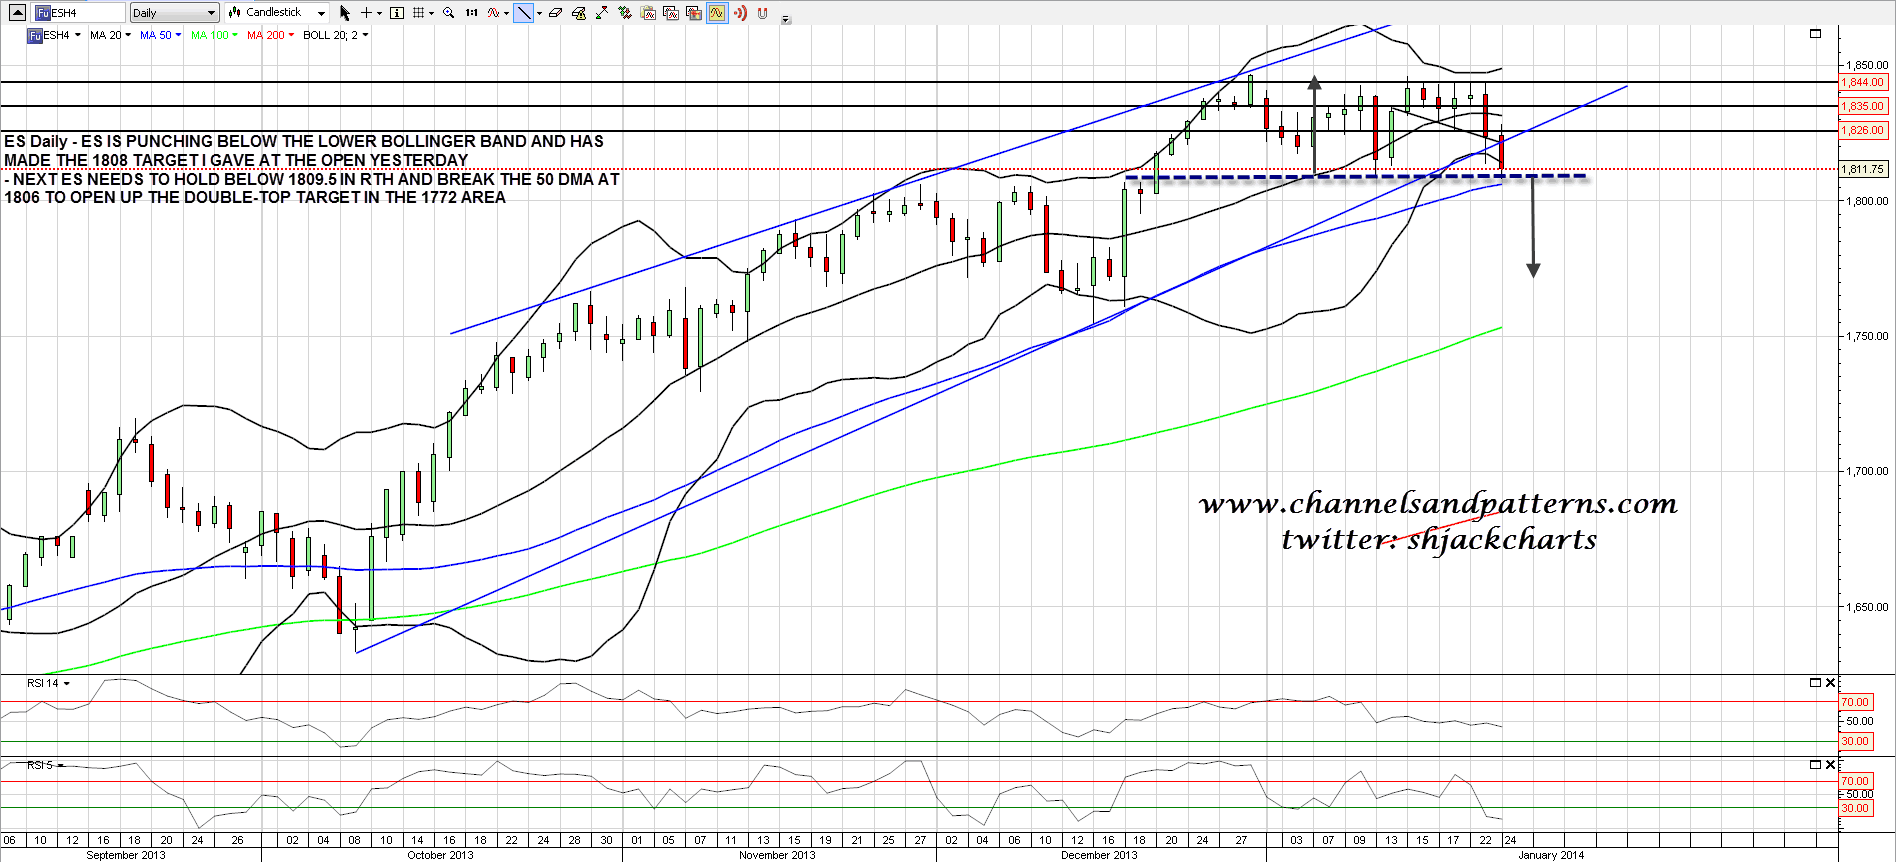
On the break below 1826 ES yesterday morning I tweeted double pattern targets (falling wedge and double-top) at 1808, and as the overnight low was 1808 dead, those targets have been met. The last ES low was at 1809.5 so the larger double-top there is breaking down slightly with a target in the 1772 area. However the 1809.5 level still needs to be broken with confidence and during regular trading hours (RTH). The key support levels on ES today are the double-top trigger level at 1809.5 and the 50 DMA at 1806. Once below those the double-top target at 1772 is firmly in play. ES daily chart:
On the SPX daily chart the key support levels are the last low and double-top trigger level at 1815, and the 50 DMA at 1812. Once those have been broken the double-top target is in the 1780 area. On 15th January I posted two target trendlines as retracement targets and rising support from 1646 has hit and pinocchioed yesterday. The second one is possible rising channel support from 1646 and I have that in the 1770 area, just above the possible H&S neckline at 1767.99. There is therefore a rich cluster of targets and support levels in the 1768-80 range. SPX daily chart:
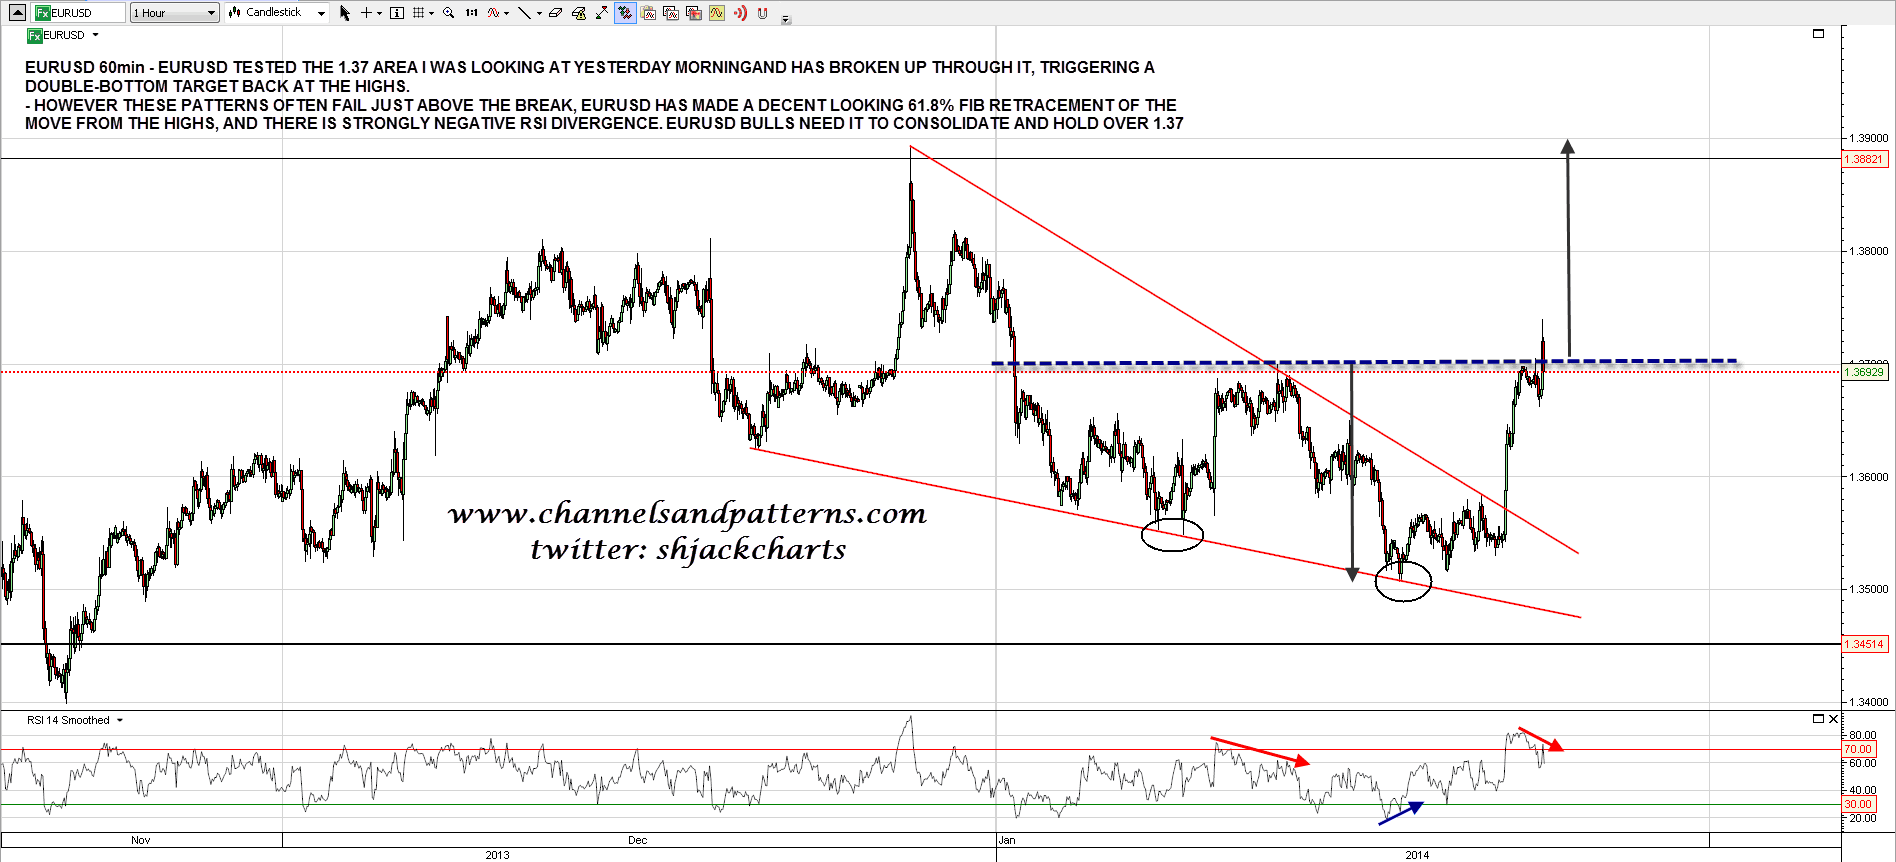
On other markets EURUSD reached the 1.37 level I was looking at yesterday morning and broke above it, triggering a double-bottom target back at the highs. However I’m a bit doubtful about that as the 60min RSI is looking toppy and the current rally high is a decent fit with a 61.8% fib retracement of the move from the current top. EURUSD bulls need this to hold above 1.37 to open up the highs again. otherwise this setup could fail at the current rally high. EURUSD 60min chart:
GC has broken declining resistance from the last rally high (and possible double-bottom trigger level). There are two big resistance levels coming up and they are the 150 DMA just under 1300 and declining resistance from the late 2012 high in the 1310-5 area. If GC can clear those levels my assumption will be that the bear market on precious metals is over, and my full attention will be on the possible double-bottom setup marked on the chart below. GC daily chart:

Oil is now testing declining resistance from the last rally high there, and if it breaks up I’ll be looking at triangle resistance and the double-top trigger level at 100.75. If oil breaks over that the double-bottom target would be in the 110.25 area. WTIC daily chart:

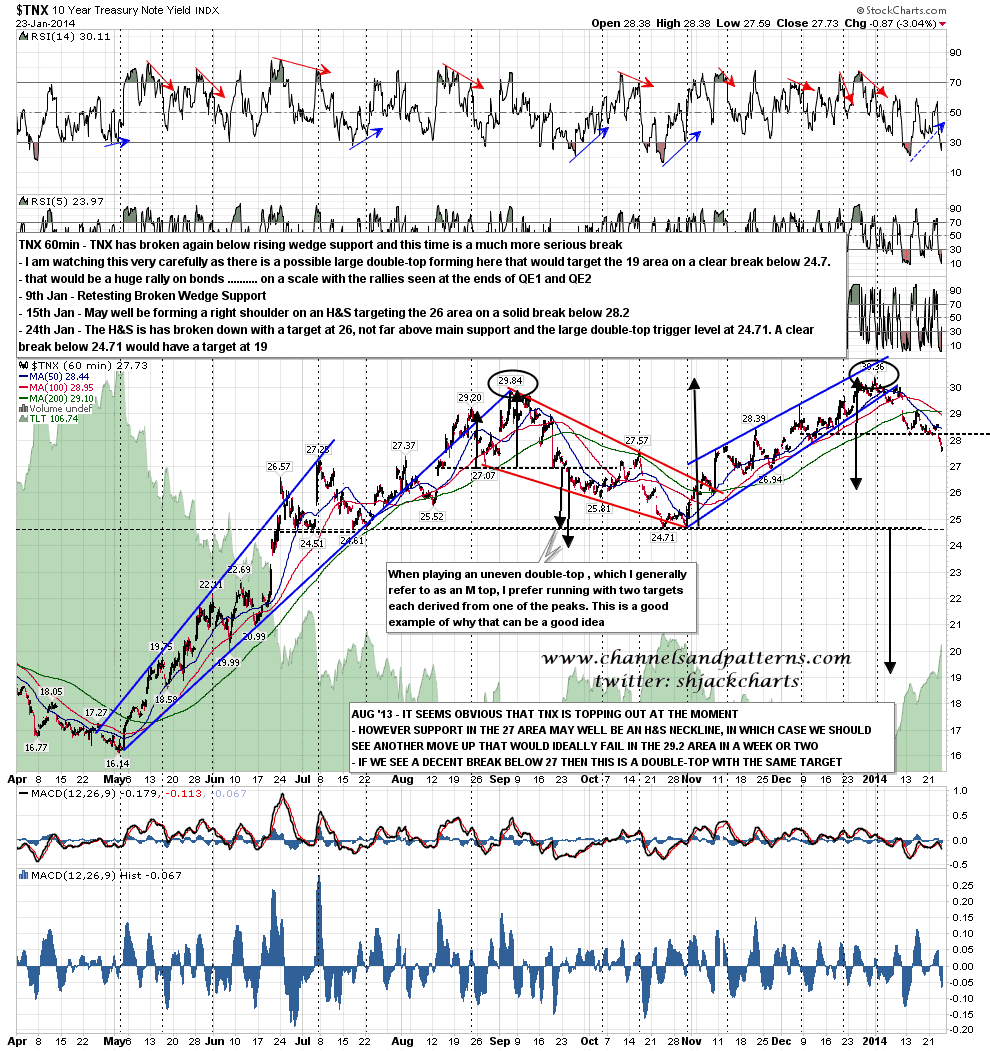
TNX has broken down with confidence from the H&S there and the target is 26, not far above the large double-top trigger level at 24.71. A break below 24.71 would of course trigger a double-top target in the 19 area, as I have mentioned before. TNX 60min chart:
The short side is looking very good here, but bears need to push today to break (and ideally close) below the SPX double-top trigger level at 1815. If they can manage that, and bears have been having some significant performance issues since 2012, then the lower targets open up and will most likely be reached in the next few days.
