
A short post today as I’m not feeling well.
SPX has been consolidating in a triangle for the last couple of days. I’m not wild about triangles as they have a strong tendency to make false breaks, making them hard to trade unless there has already been a false break. SPX 5min chart:

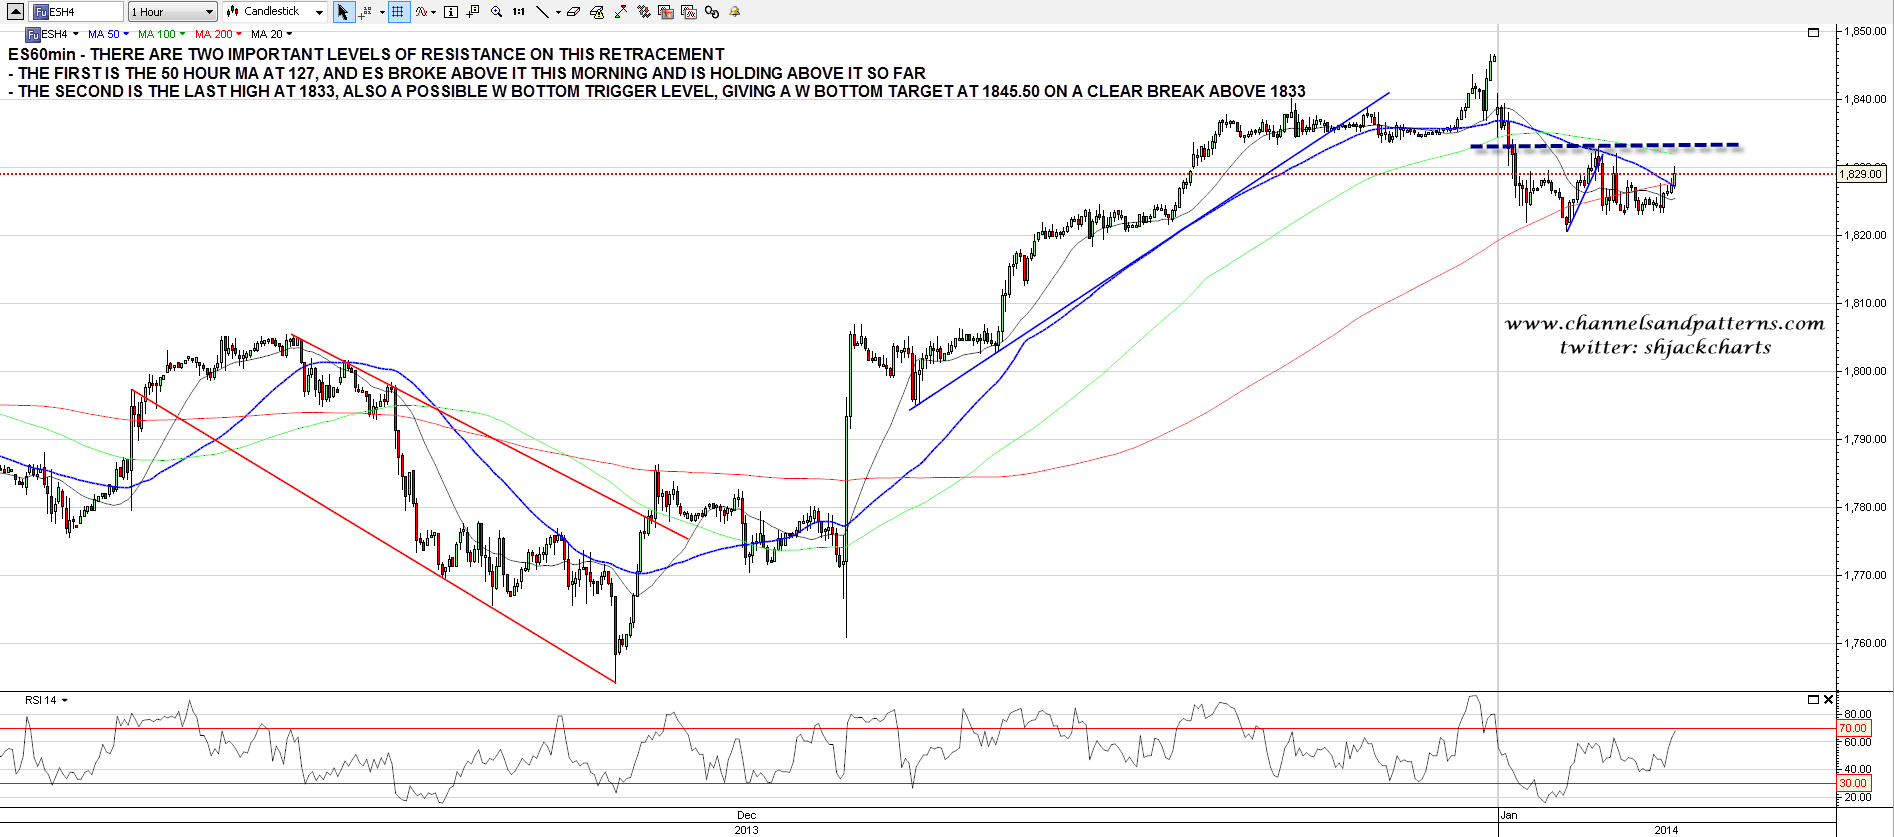
On the ES chart this is clearly a possible W bottom forming, and on a break above the last high at 1833 ES, then the W bottom target would be the 1845.5 area. Encouragingly for the bulls today ES recovered over the very important 50 hour MA a couple of hours ago for the first time since this retracement started, and if we see a further boost over 1833 this morning then the low for this retracement is most likely in. ES 60min chart:
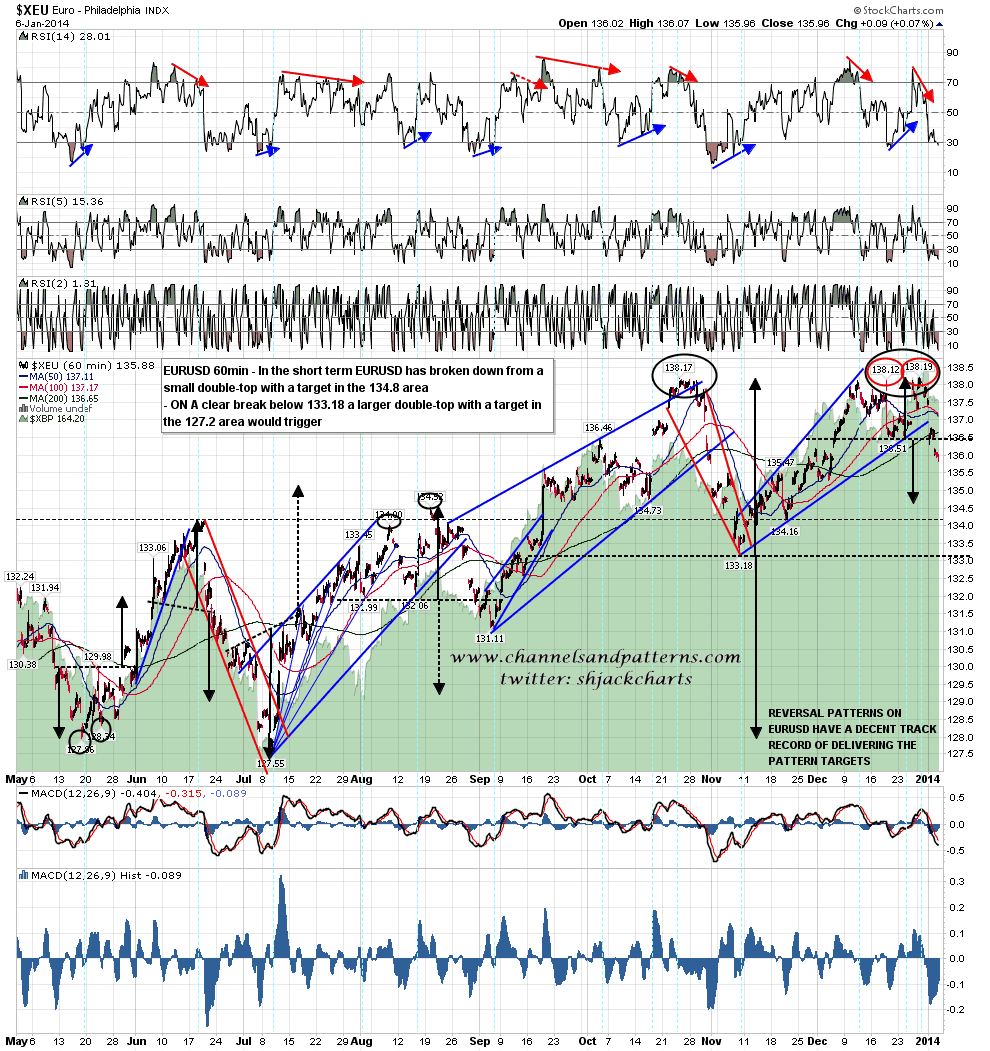
On other markets EURUSD has broken down from a small double-top targeting the 134.8 area. However the more interesting thing about this chart is the much larger double top that would target the 127.2 area on a clear break below 133.18. This would have important implications for USD and I’m watching this closely. EURUSD 60min chart:
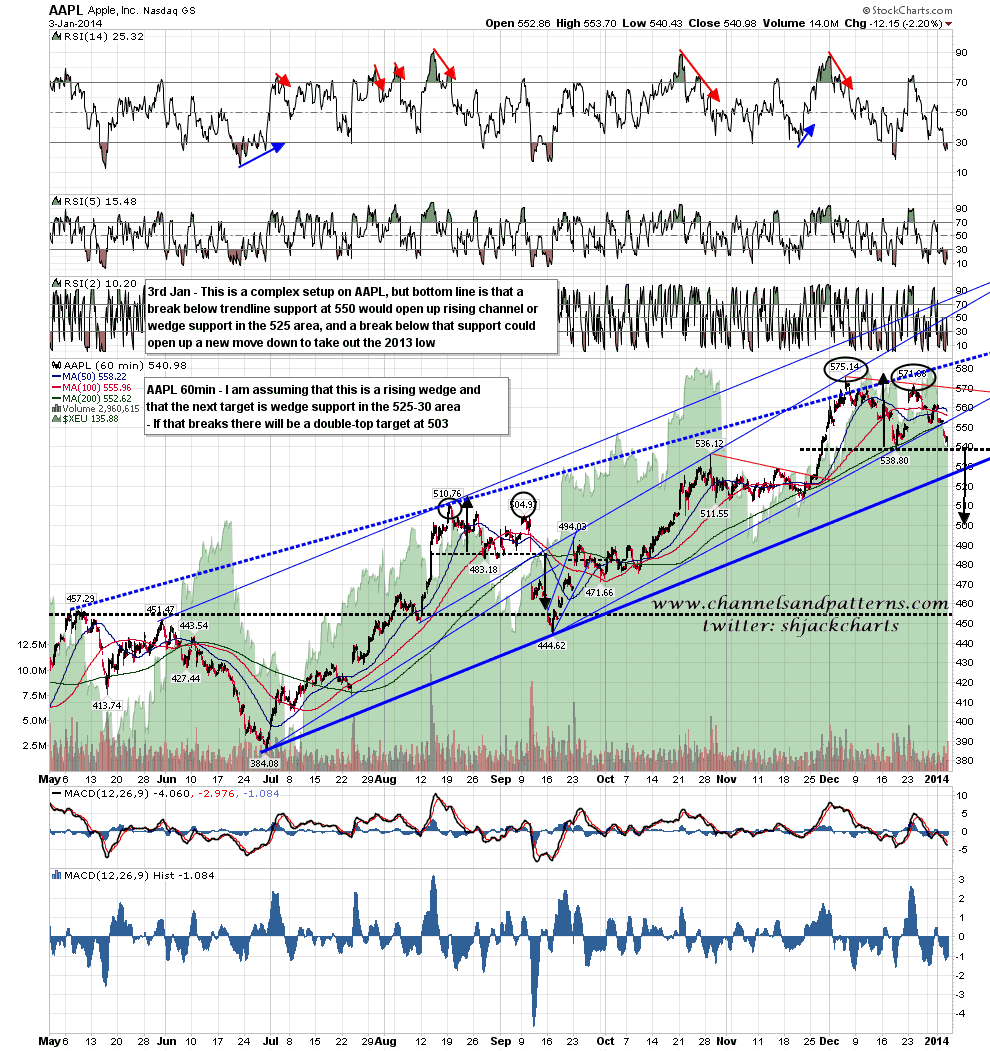
AAPL broke down from the small rising megaphone support it was testing on Thursday and is about to trigger a double-top target at 503 on a clear break below 538.80. There is decent rising support in the 525-30 area however and that could hold. AAPL 60min chart:
We’ll see what happens this morning, but the pattern setup is suggesting that SPX may well retest the current highs shortly. If so this was most likely not the retracement that I was looking for, and I’d be watching for a very possible larger double-top at the retest of the highs to take SPX to my main retracement targets. Time will tell as always.
