
To an extent Friday went much as I laid it out in the morning. SPX overshot the perfect retests of the daily middle band and the 50 hour MA by a couple of points, but on the NDX and RUT patterns I was looking at we saw perfect tests and reversals at pattern resistance. This gives the bears the edge as long as resistance on those patterns holds, and gives me two excellent marker patterns to watch as we wait to see whether the double-top on SPX is going to break support at 1839/40.
While these last I’ll be posting both of the NDX and RUT patterns every day, and on RUT the next obvious target is the double-top target in the 1130 area, the 61.8% fib retrace just above at 1132, and falling channel support which is currently in the same area. RUT 60min chart:

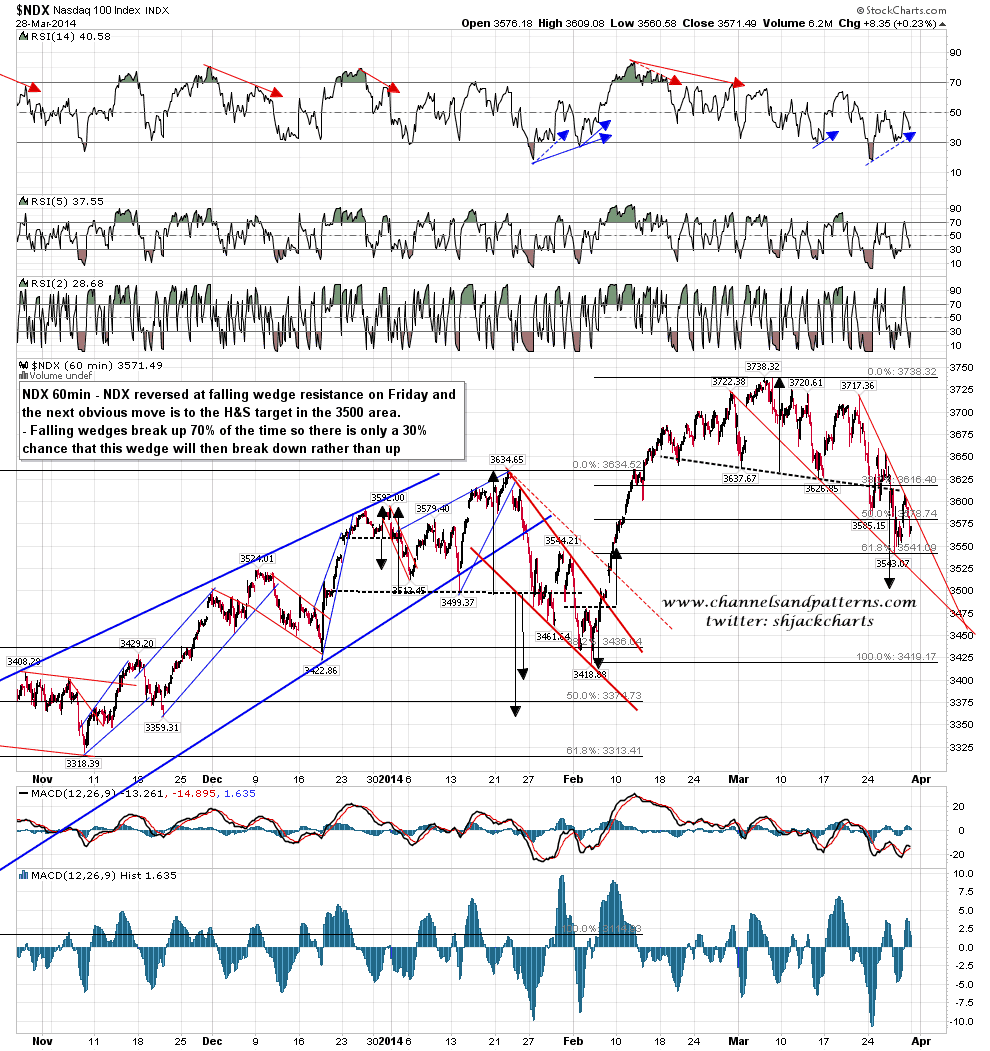
On NDX the H&S target in the 3500 area is now a decent fit with falling wedge support and the obvious next move is to that area. NDX 60min chart:
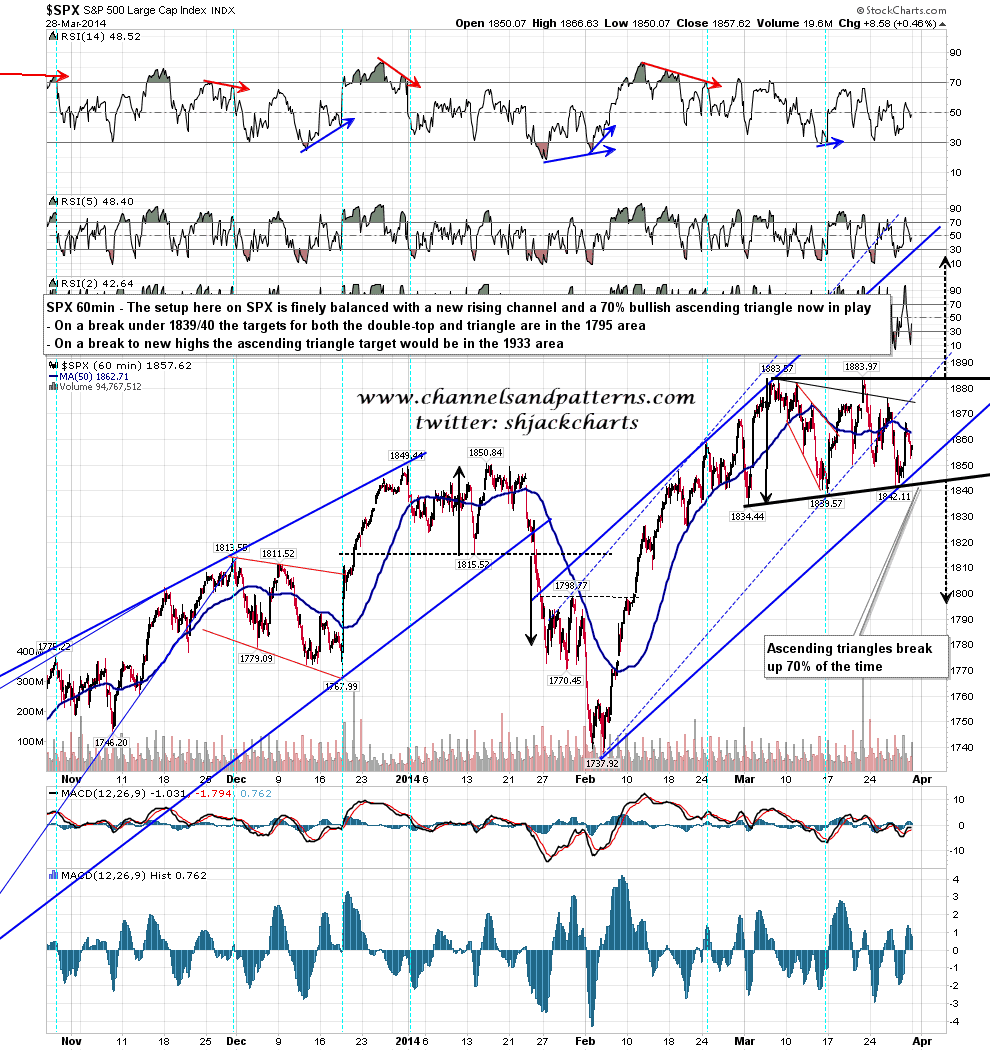
So far, so bearish, but the setups on SPX and ES are much more ambiguous here, with an impressive three bullish patterns established towards the end of last week, all of which must be broken before the double-top can play out. Two of those patterns were established on SPX, and they are a new rising channel from the 1737 low, and a 70% bullish ascending triangle. If that triangle breaks down then the 1795 area target is the same as the double-top target, but if it breaks up the target would be the 1933 area. SPX 60min chart:
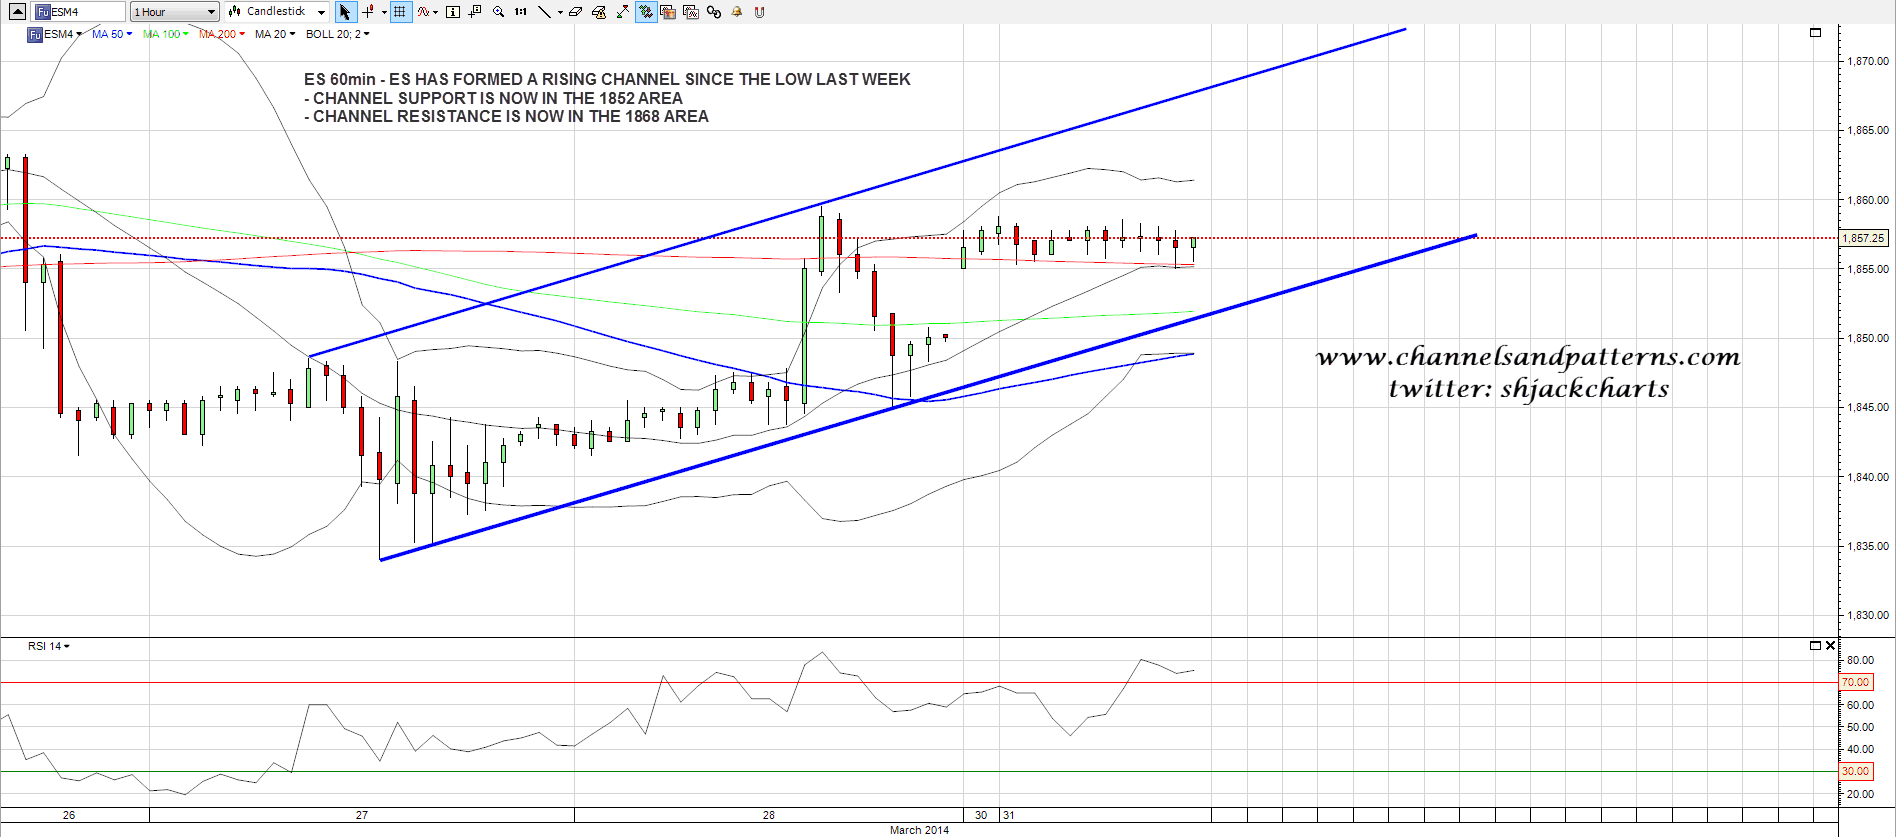
The other bullish pattern is on ES and that is a rising channel from the low last week. Channel support is currently in the 1852 area and channel resistance is currently in the 1868 area, which if we were to see it would be yet another test of 1874/5 resistance on SPX. ES 60min chart:
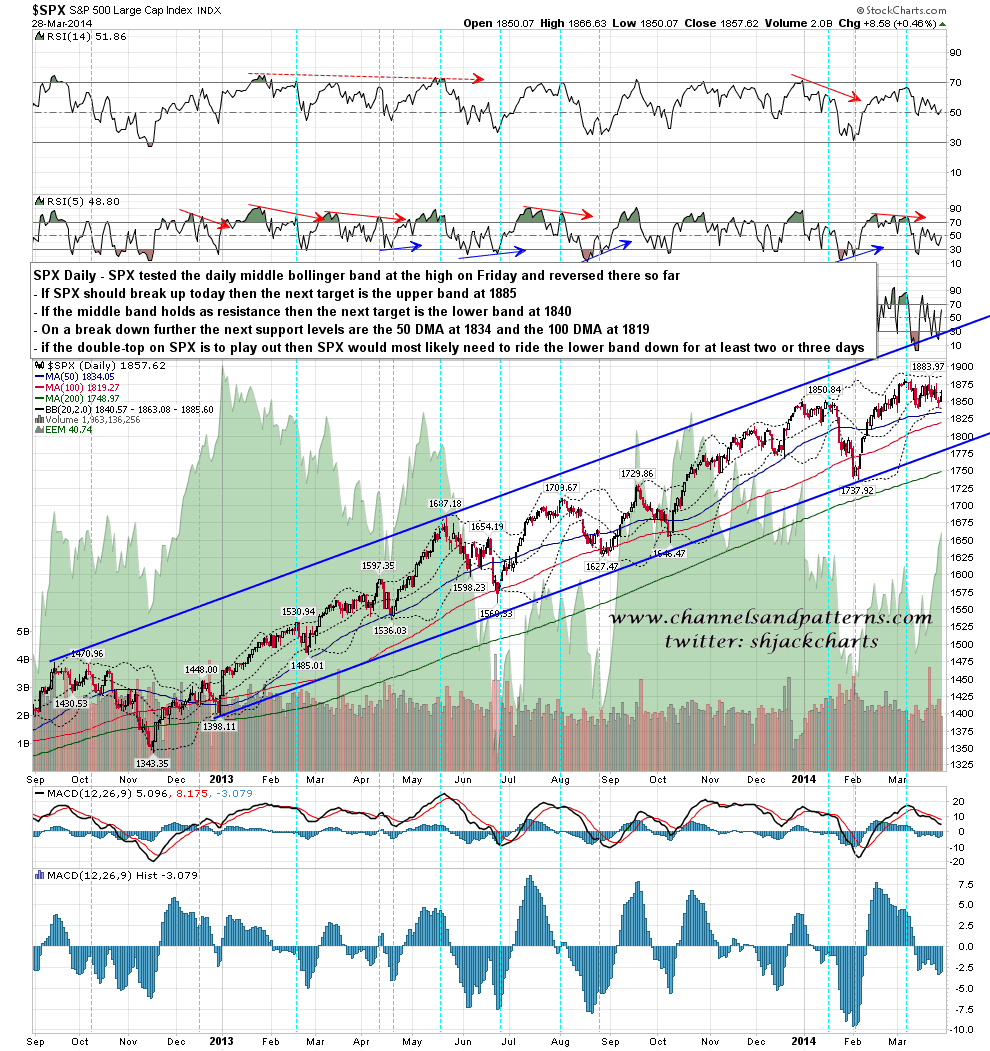
On the SPX daily chart the close today is important. The high on Friday was a decent retest of the daily middle band. If that holds then the next target is a retest of the lower band, now at 1840, and if SPX can break back above the middle band then the upper band is now at 1886. SPX daily chart:
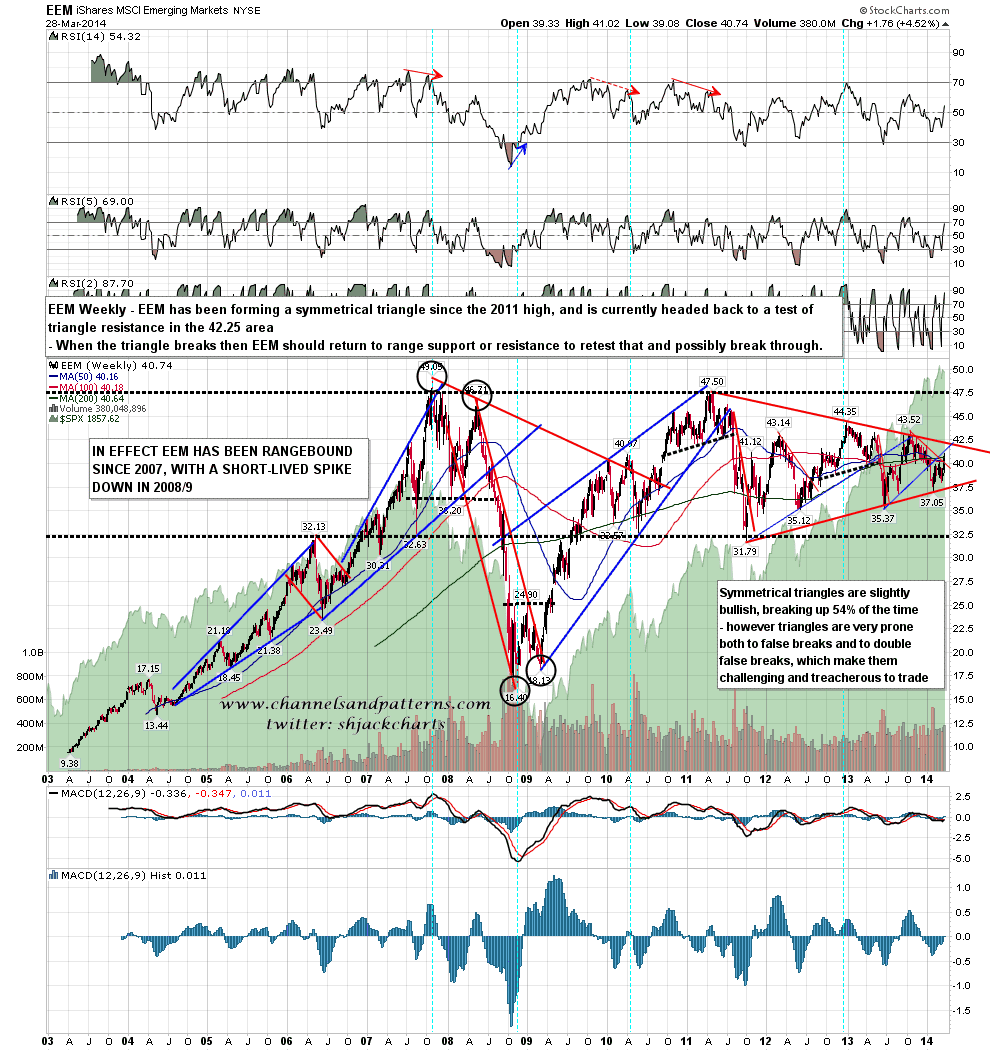
On other markets the EEM chart was mentioned to me a couple of times last week, and I’ve been neglecting that chart lately because it has been, and remains, rather uninteresting. EEM has been forming a large symmetrical triangle since the 2011 high, and is moving back towards triangle resistance. The available range within this triangle is now less than 5. I’m also not keen on triangles as I’ve mentioned before and while this triangle is telling us that we should expect to see a test of range resistance at 47.5 or range support at 32.5 in the not too distant future, it’s hard to say which of those is more likely, though I’m leaning long on the basis that the last test of one of those was a test of range support. EEM weekly chart:
ES is at 1861 as I write, and if that holds into the open then the patterns on NDX and RUT will most likely break up. If that happens then we might well still see a test of the lows there, but the technical odds would be shifting significantly in favor of the bull side overall. On the bigger picture SPX is either topping out or consolidating here, and if we don’t see a break down soon, then we’re going to see SPX break up instead.
