
Well I was saying yesterday that the negative divergence on the SPX daily RSI 5 and NYMO was giving the edge to a bearish resolution to the range and we may at last be looking at the start of the retracement for this big wave up from the 1737 low.
On the SPX 60min chart the 50 hour MA broke down yesterday afternoon and SPX broke support on a double-top targeting the 1850 area, which is also the 23.6% fib retracement level. As long as SPX doesn’t close an hour back over the 50 hour MA then I think the chances of reaching there are excellent. If we see SPX break back over the 50 hour MA then I’ll be cautiously leaning bullish, if only because we have seen so many total bear fails since November 2012. SPX 60min chart:

On the daily chart the 1850 target is a perfect hit with a retest of the middle bollinger band. If SPX breaks below there then I’ll be watching the possible H&S neckline at 1834, but the key support levels are the 50 DMA at 1828, very close to the 38.2% fib retracement level, and the lower bollinger band, currently at 1812 and a good fit with the 50% fib retracement level. SPX daily chart:
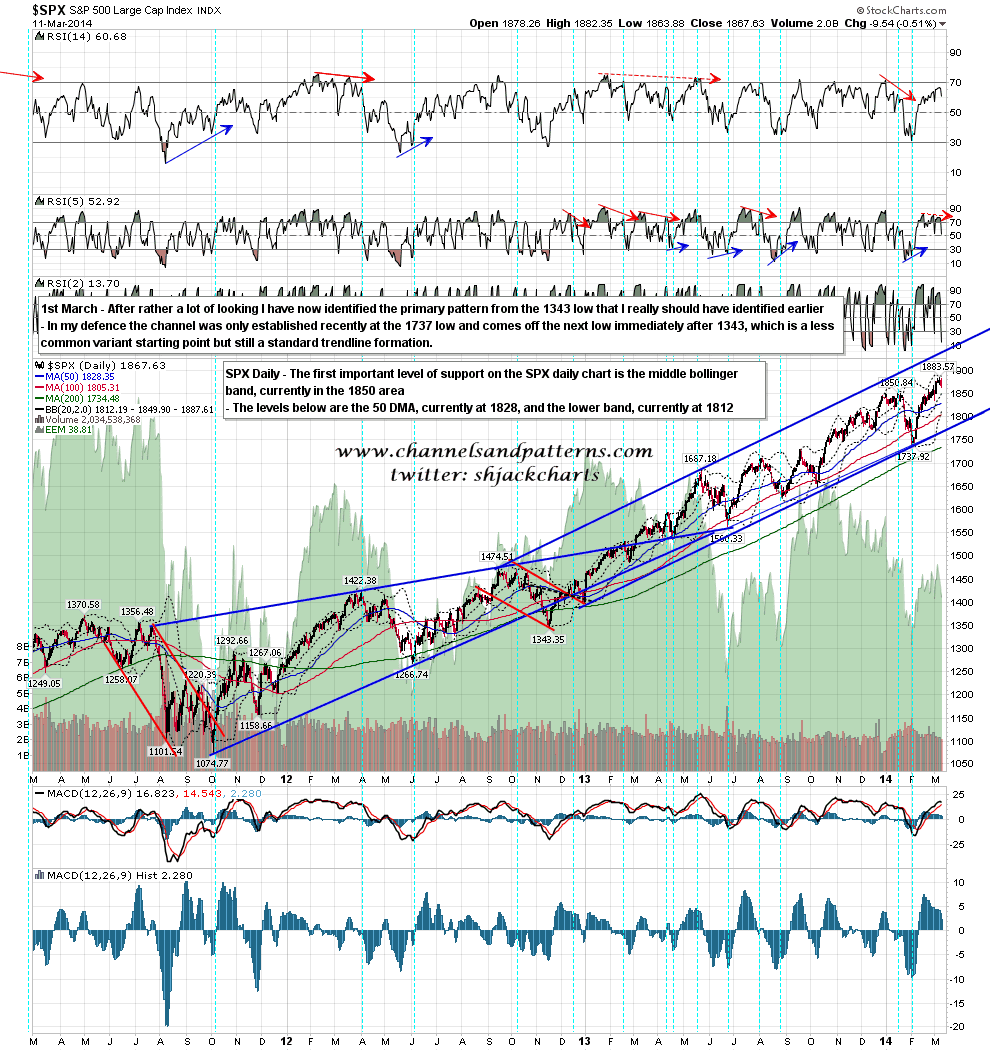
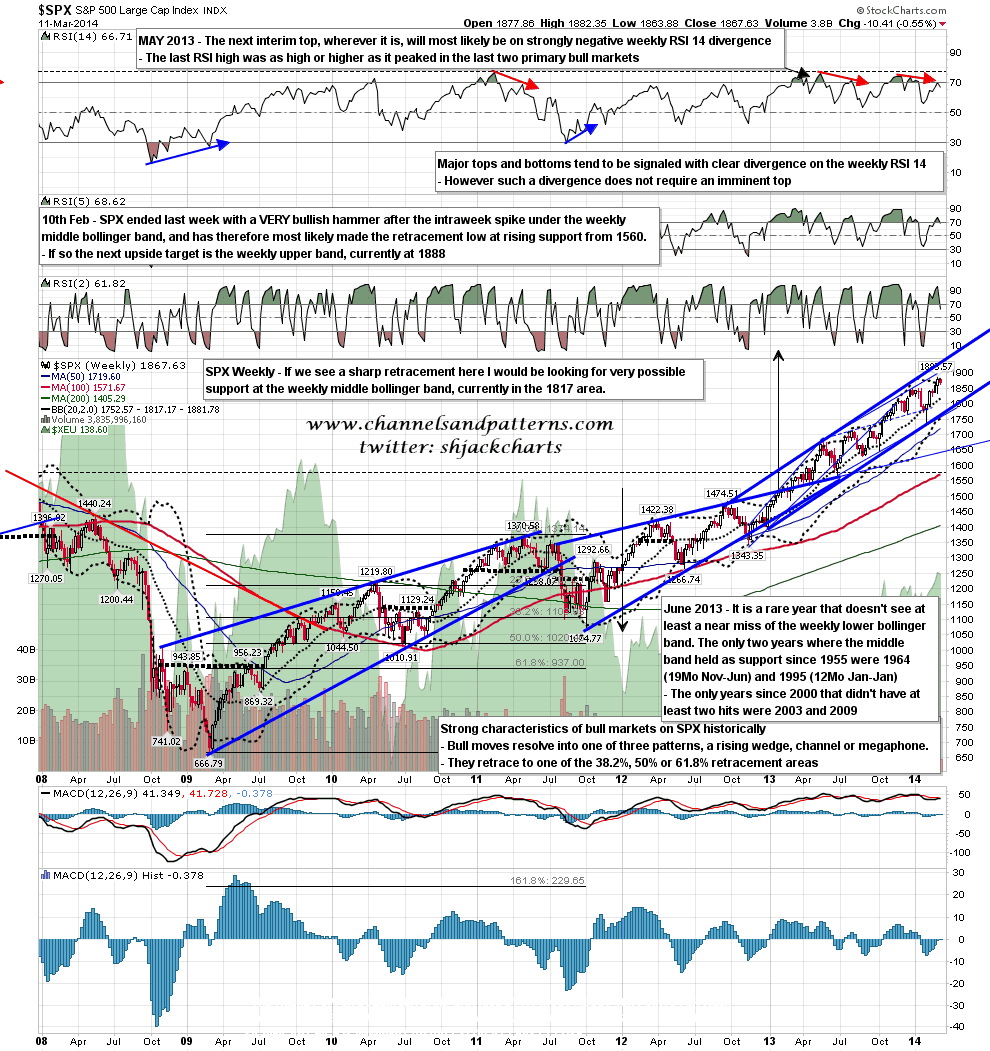
That last target on the daily chart is also a reasonable fit with the weekly middle bollinger band, currently at 1817, particularly as the daily lower band has been trending up sharply, and may well therefore cross the weekly middle band this week. SPX weekly chart:
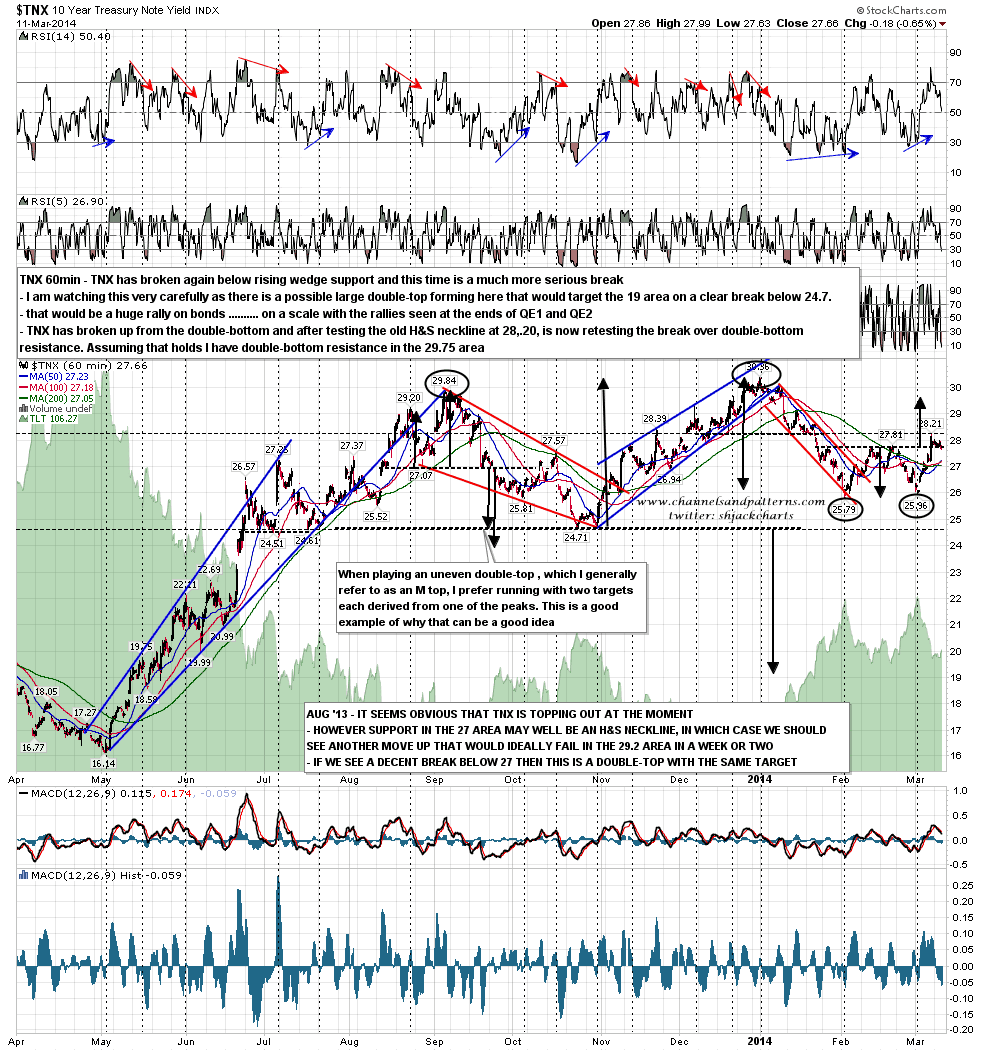
On other markets oil has broken back below broken double-bottom resistance and we may have seen a significant change in trend on the scale I was looking at on Friday morning. You can see that post here. TNX has broken over double-top resistance and has tested the old H&S neckline at 28.2 before returning to retest broken double-top resistance. Assuming that survives the retest then the double-top target is in the 29.75 area. TNX 60min chart:
Posts are a bit shorter this week as the clocks don’t move onto summer time until March 30th here, so I’m needing to get them out an hour earlier. I’ll be trying to post more charts on other markets on twitter during the day.
As for SPX today there is obviously a possibility looking at ES at 1858 here that SPX might go straight to that 1850 target this morning and, if that is all we going to see, then bounce straight back from there. However I have a strong suspicion that we are going to see more downside than that, and if I’m right, then as soon as can identify a pattern for the move I’ll be posting it on twitter, though that well well not be today. I’m thinking a gap fill today is possible but is much less likely if SPX opens under 1859, which it may.
