
I was asked yesterday what odds I would give to the Spring high already being in and a retracement towards a retest of the 1550-1600 area having already started. I replied that if this was a bullish setup I’d be giving odds and 90% +, but as it was a bearish setup I’d be thinking 70/30. That may be too cautious, but the bears have been having significant performance issues in recent years.
On the SPX daily chart the opening spike down tested the lower bollinger band, and made the low for the day there. At the time of writing ES has rallied about 12 handles from there and the obvious resistance levels are in the 1848 and 1856 areas on ES (1855 and 1863 on SPX). The obvious target for a strong bounce off the daily lower bollinger band is of course the middle bollinger band, and that is currently at 1863 SPX, the higher of those two resistance levels. SPX daily chart:
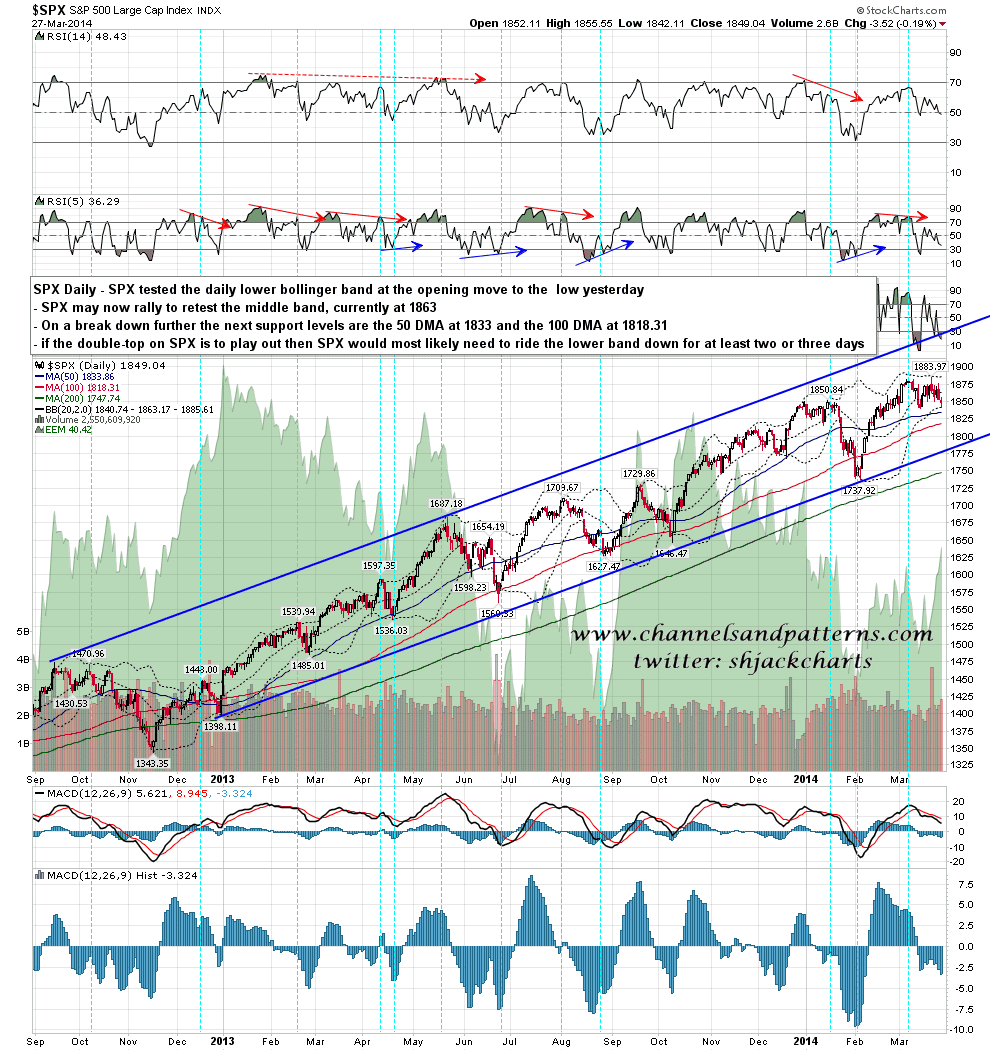
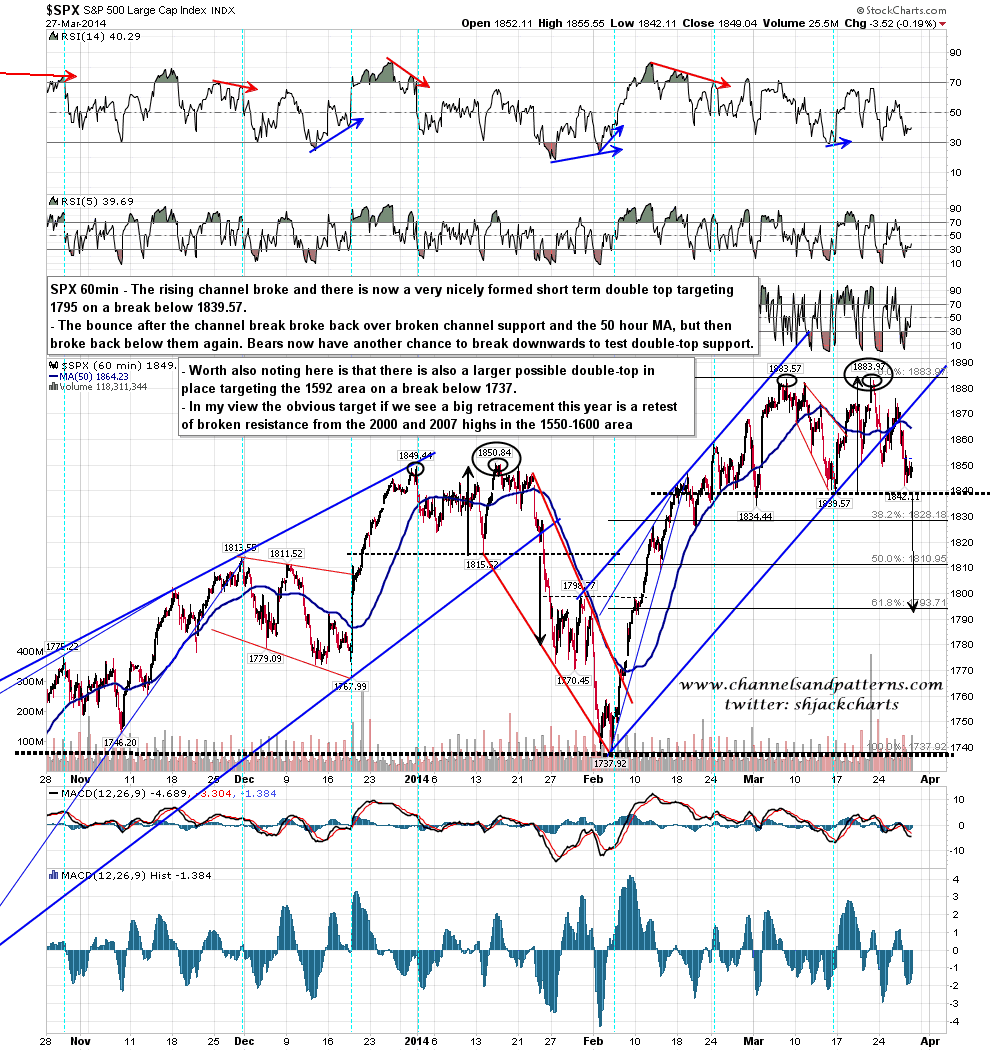
On the SPX 60min chart double-bottom support is at 1839/40 and that has not yet broken down of course. If we see a bounce to test the daily middle band at 1863 SPX then it’s worth noting that the 50 hour MA closed yesterday at 1864 SPX. That 1863/4 resistance should now be solid and if we should see a break over it now then may still just be trading a range rather than topping out. SPX 60min chart:
I’ve been running Dow, TRAN, NDX and RUT charts to get a spectrum of what is happening on US equity markets and these all have clear topping setups but are at different stages. Dow is the strongest of the four, having broken the declining channel there now but still testing double-top support on the smallest of the three nested double-tops on that chart. Dow 60min chart:

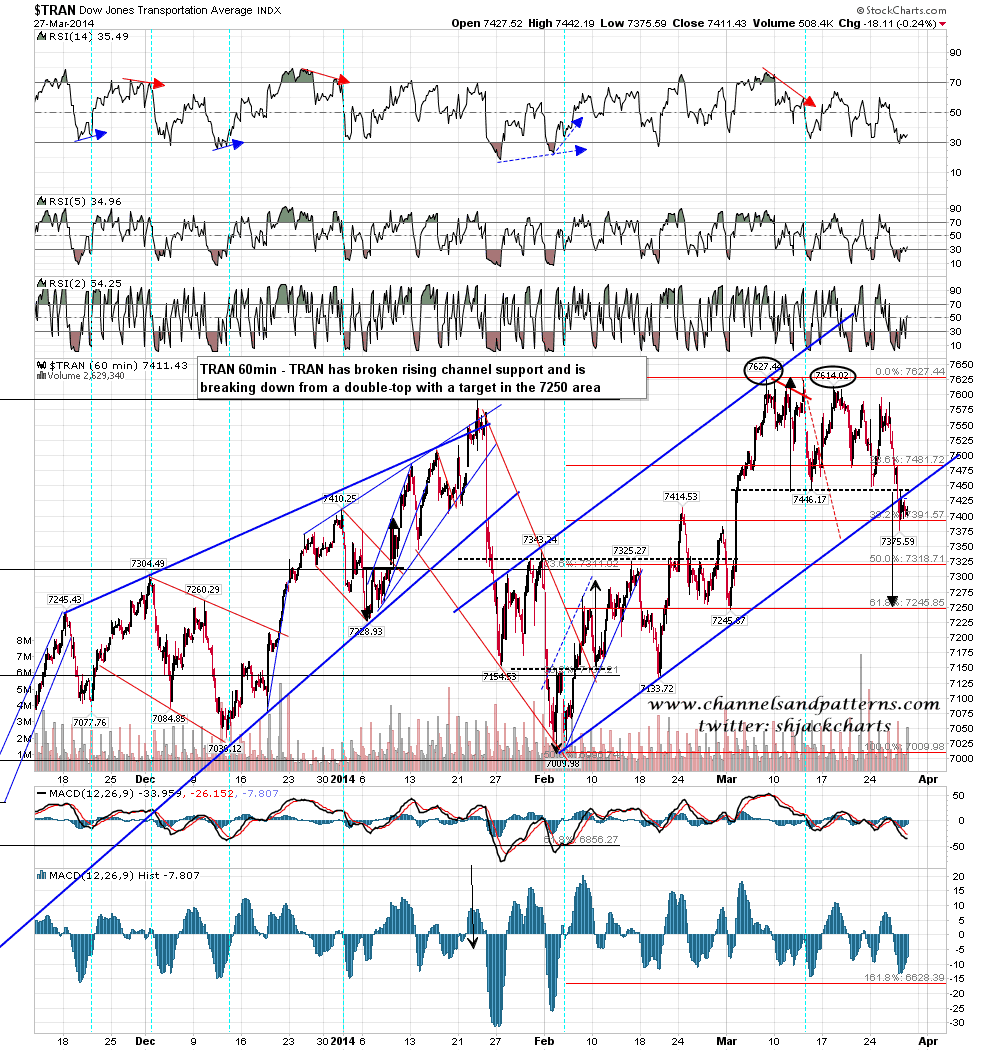
TRAN is just a little weaker, trading under first double-top support, having broken the rising channel there on the same day as Dow. TRAN 60min chart:
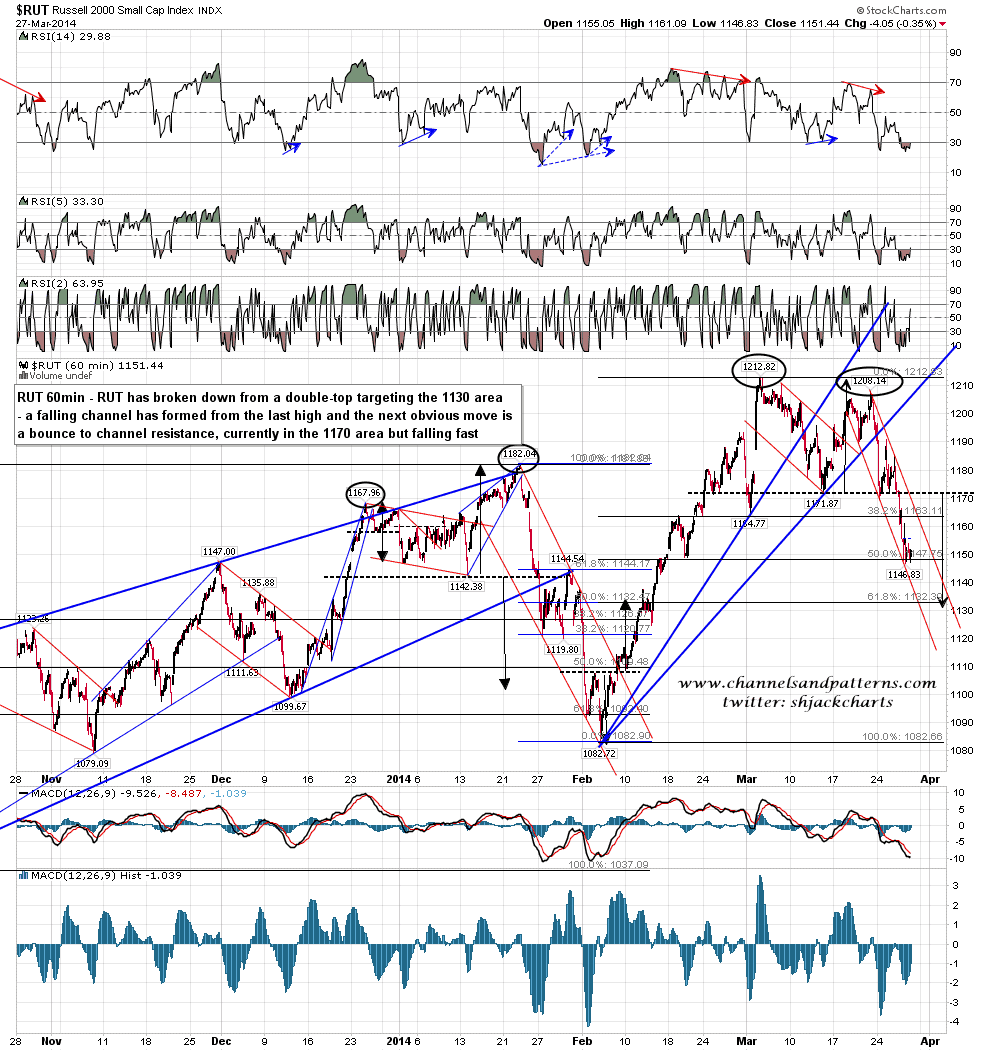
On NDX and RUT the process is more advanced and they have clearly broken down from their topping patterns. On RUT the double-top has broken down with a target in the 1130 area, and a falling channel has formed from the last high. The next obvious move within that falling channel is a bounce to test falling channel resistance, currently in the 1170 area but falling fast. RUT 60min chart:
On NDX the H&S has broken down with a target in the 3500 area. A falling wedge has formed from the high and the next obvious move within that wedge is a test of wedge resistance, currently in the 3610 area and falling fast. NDX 60min chart:

There is clear bull/bear line today on SPX at 1863/4, which is 1856/7 on ES. My ideal day would be a morning test of that level, followed by failure that would break SPX down through 1839/40 double-top support. There is decent resistance at 1855 SPX however and it may be that any rally today might stall there.
