
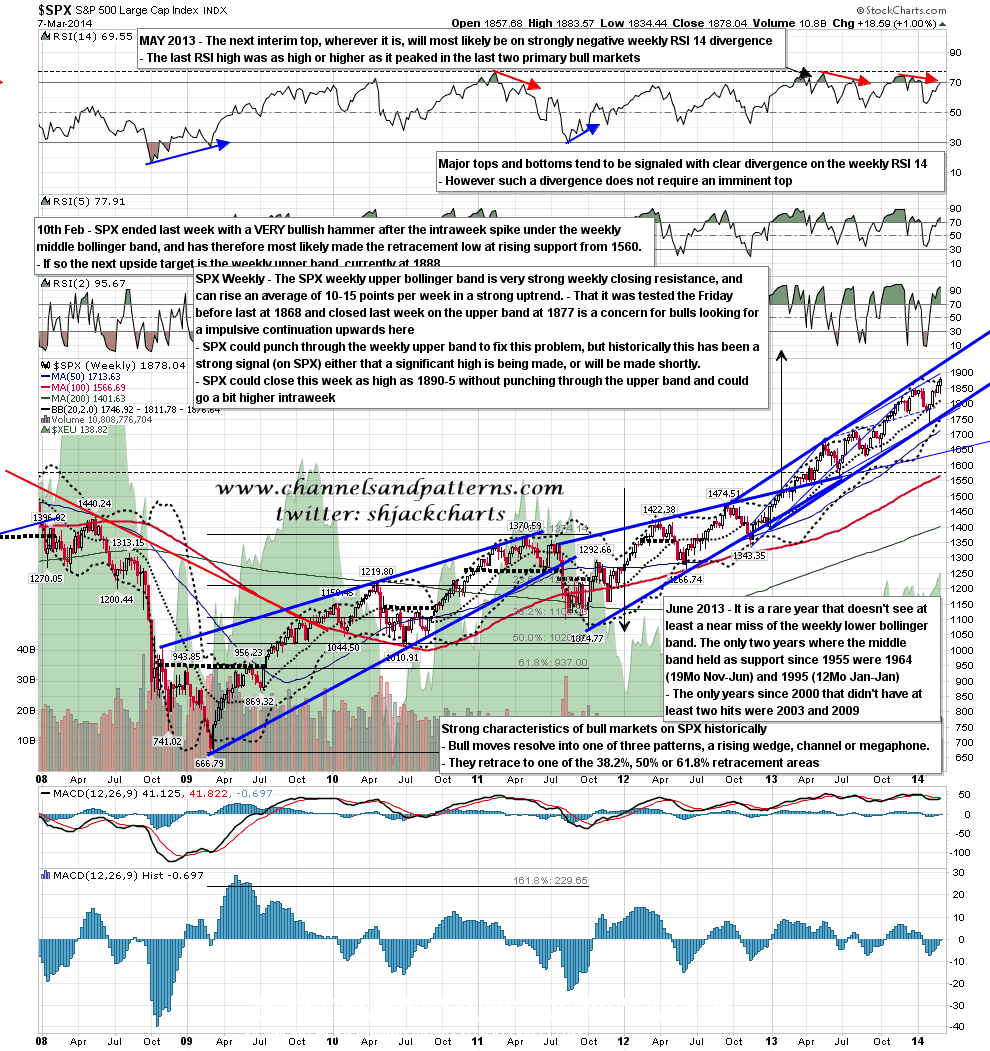
Upside on SPX was capped by the weekly upper bollinger band as expected, and the close on Friday was at 1878.04, a point and change above the upper band close at 1876.64. SPX could continue to trickle up under the weekly upper band for a while yet, or we could see some retracement to clear some headroom for a more impulsive move. I’m giving the weekly close ceiling (without a rare and bearish punch over the band) this week in the 1890-5 range. SPX weekly chart:
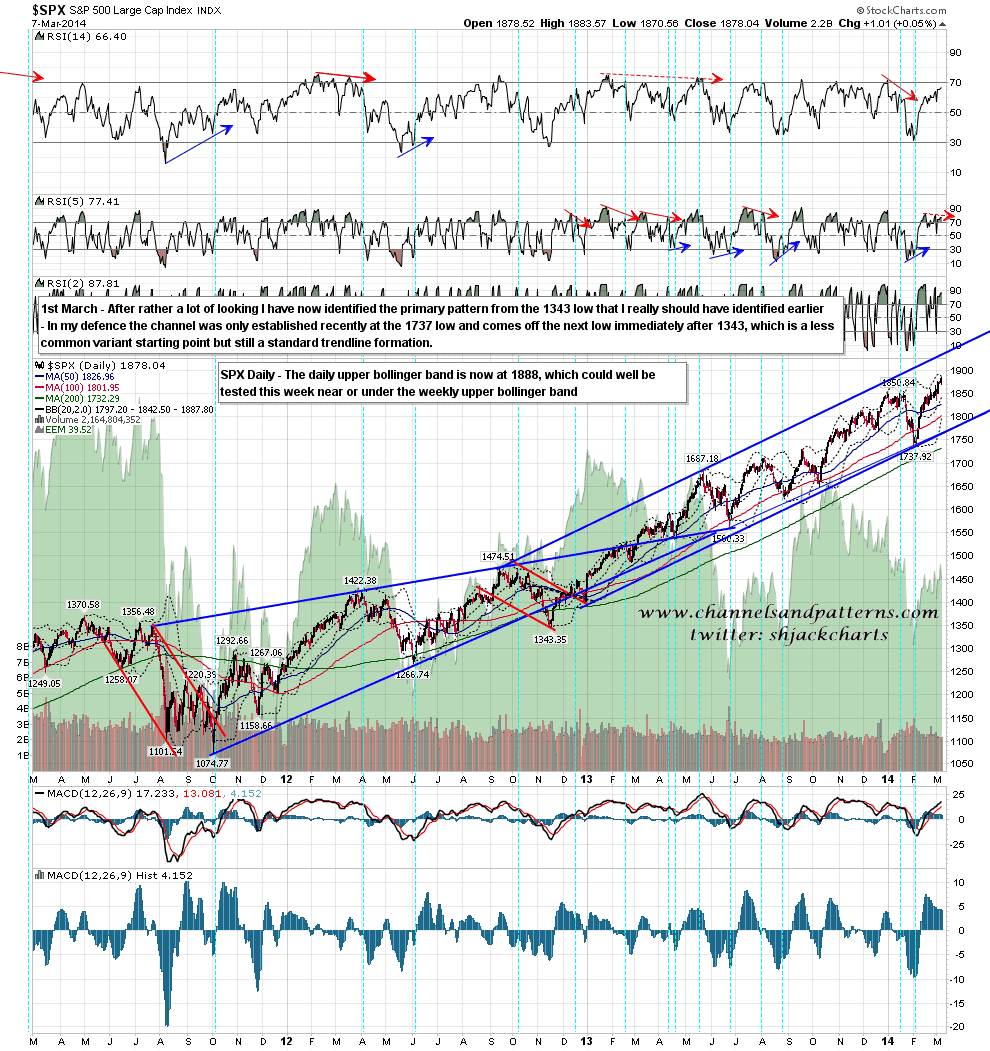
So which way is this likely to go this week? Well there’s definitely an argument for hitting the SPX daily upper bollinger band, now at 1888 and still declining slightly. That could now be hit in a move that would still be within or close to the weekly upper band. We might well then see a retracement to test the daily middle band (the 20 DMA), currently at 1842.50, or the 50 DMA, currently at 1827. Worth noting on this chart is the significant negative divergence on the daily RSI 5, which is telling us that we could see a sharp retracement at any time. SPX daily chart:
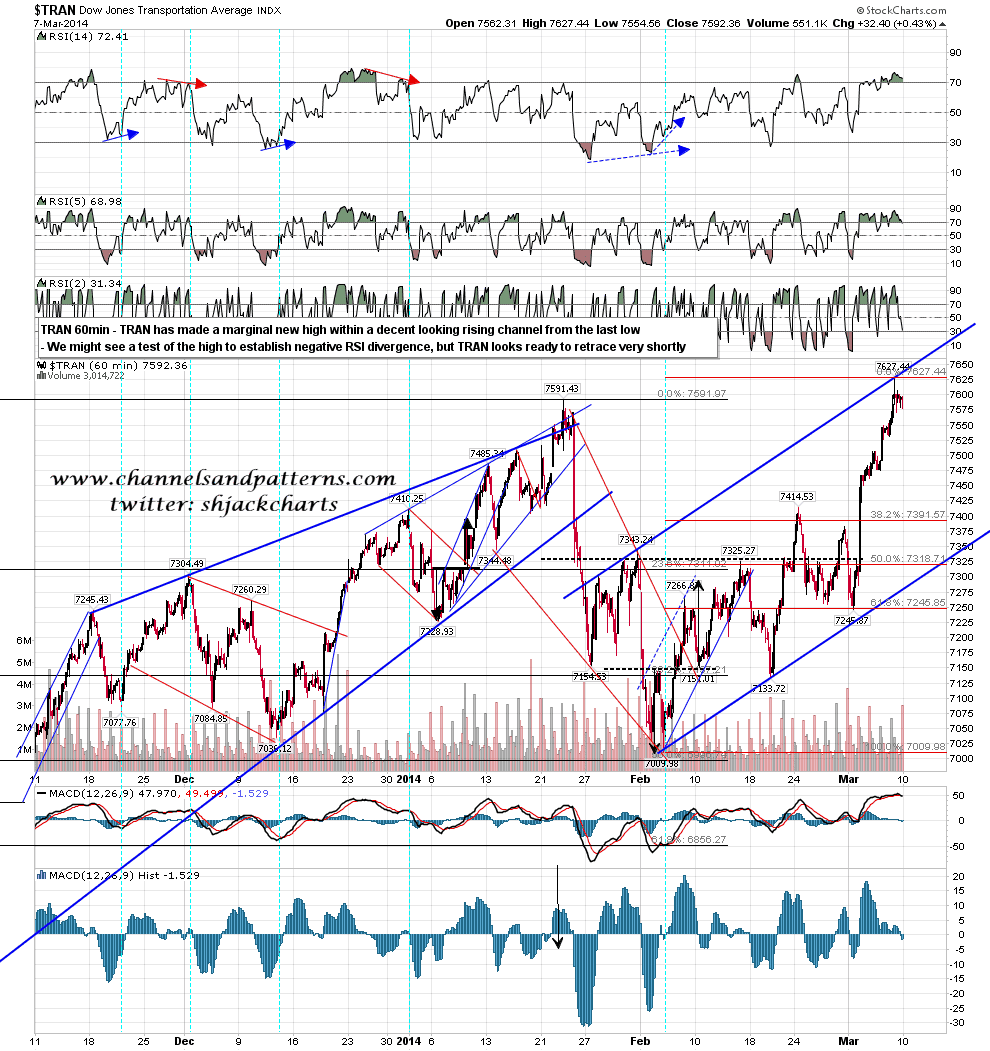
There’s not much of directional interest on other indices, except for TRAN, which has made a new high and hit channel resistance on a decent quality rising channel from the last low. This is suggesting a sharp retracement sooner rather than later, though a retest of the highs on TRAN to establish negative RSI divergence would be very possible on this setup. What I would add is that TRAN has made a new high and as yet Dow has not, so there is a Dow Theory non-confirmation at the moment. I’m not thinking that has any great technical significance, but I have noticed in the past that we often see sharp retracements when this happens. TRAN 60min chart:
I was planning a weekend post on the US dollar but didn’t have time, so I’m going to cover that this morning. There are six components in the US dollar index, and the three largest are EURUSD at 57.6% weight, JPYUSD at 13.6% weight, and GBPUSD at 11.9% weight. Between them these three components comprise 83.1% of the US dollar index and I’m going to be looking at these three to see what they are telling us about the likely direction for USD in 2014.
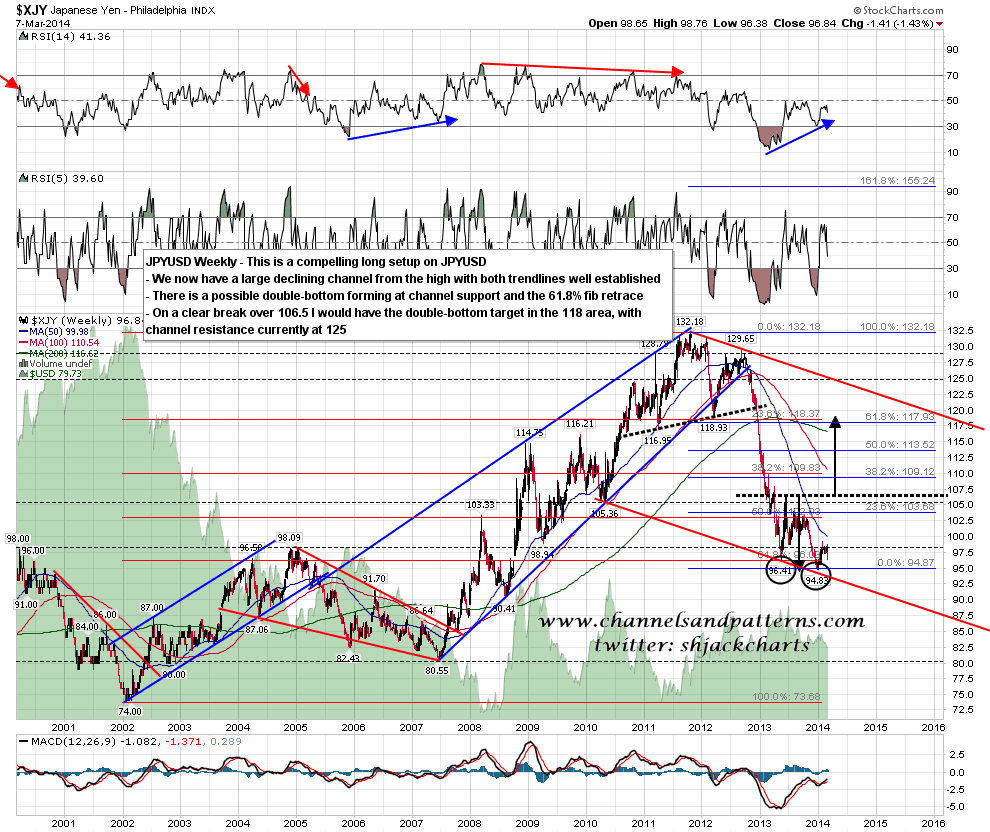
The most bullish of the three is JPYUSD, and I posted this chart a few weeks ago with the comment that this was a very bullish looking setup with a lot of potential upside. That remains the case and the entry has improved a bit. JPYUSD weekly chart
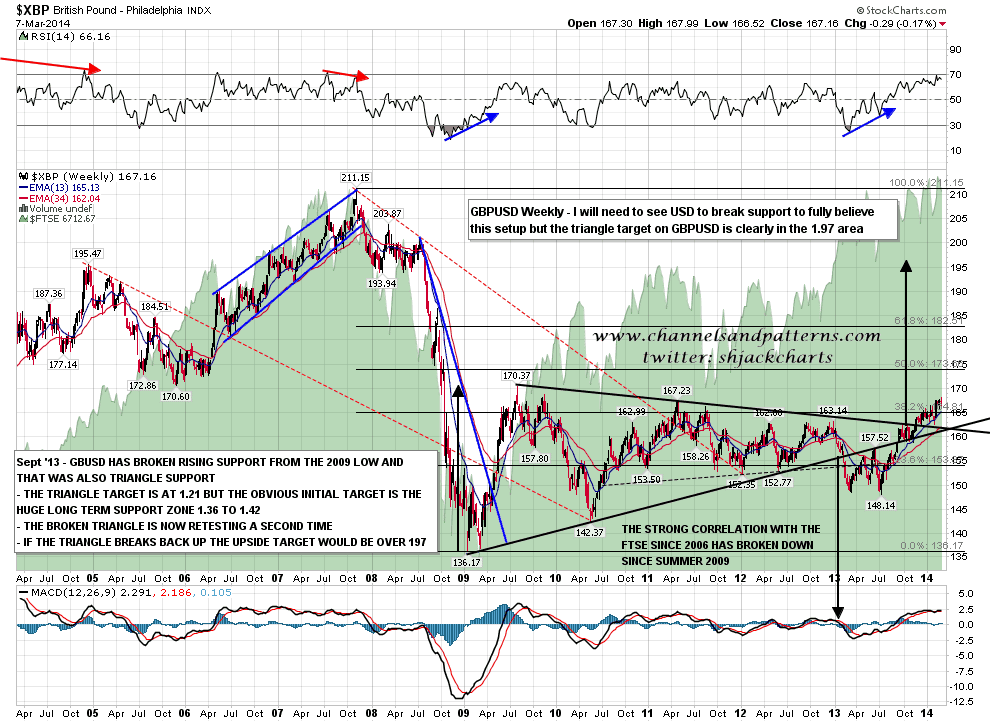
On GBPUSD there is a big triangle from 2009 that broke down last year and then, as triangles so often do, broke back up again with a target in the 1.97 area. That looks ambitious but if there is a general breakdown on USD then it may happen. I also have a slightly less ambitious alternative triangle target at 1.90. GBPUSD weekly chart:
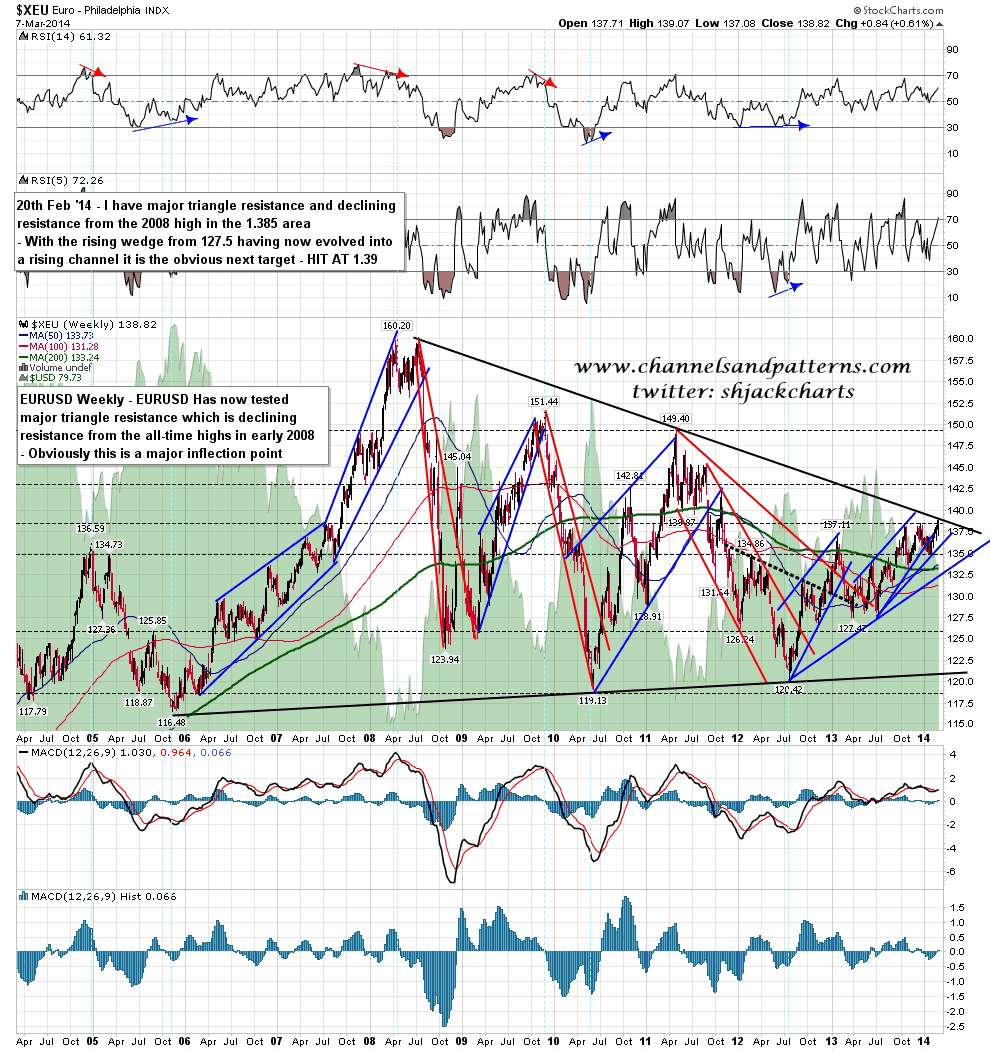
EURUSD is the majority of the USD index and there is an even larger triangle there from 2006-8. I posted this chart two weeks ago with the observation that the next obvious target was triangle resistance and that was hit late last week. EURUSD may break up here and if it holds that break then the most modest triangle target would be a test of the 2008 highs at 1.60, and very possibly a run to 1.70. EURUSD weekly chart:
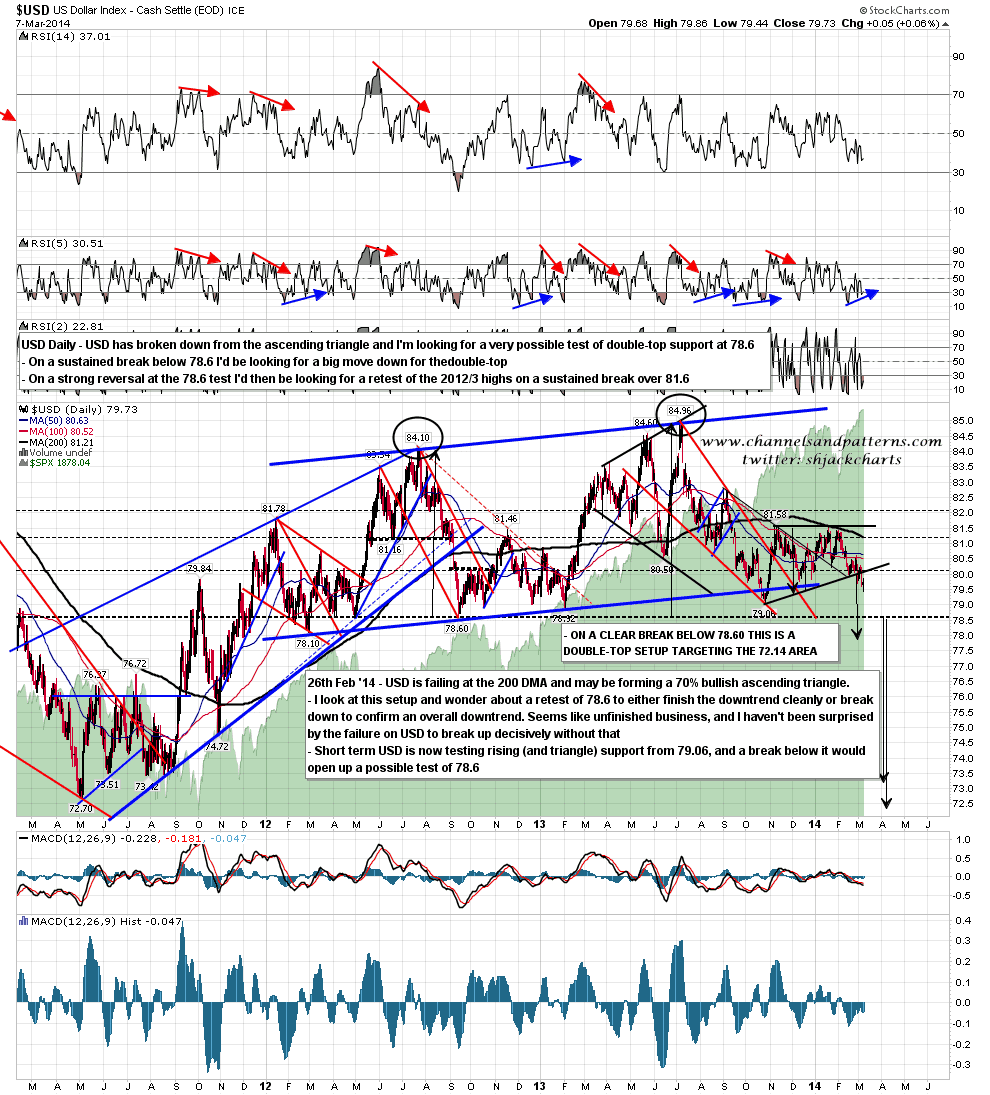
So there is potentially a lot of downside coming on USD, and we can see that possibility clearly on the USD chart. I suggested on 26th February that we might well see the (70% bullish) ascending triangle on USD break down to open up a test of double-top support at 78.60, and that triangle has now broken down. The bull scenario here is that USD tests that low to make the second low of a double-bottom that would then target a retest of the 2012/3 highs on a sustained break back over 81.6. The bearish option, not as popular with analysts but better supported by the JPY and GBP charts, is that USD breaks support at 78.6 and triggers a double-top target in the 72.14 to 73.5 range, effectively for a test of the 2011 low. My view here is that while this could go either way, the charts are definitely leaning towards the bearish option at the moment. USD daily chart:
Overall my view on SPX this week is leaning bearish, mainly because firm resistance is so close above. We may well see the SPX daily upper bollinger band, currently at 1888, tested early in the week and if so that would be a very appealing short entry for a very possible subsequent retracement.
