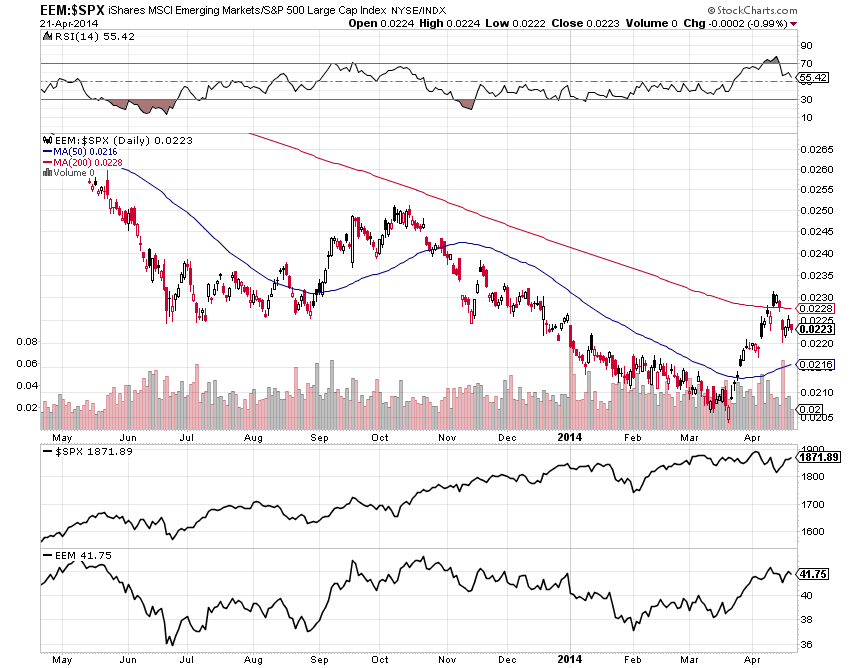
I’m watching emerging market weakness vs the S&P 500 to see if weakness persists, or whether investors increase their risk appetite and place their bets on emerging market recovery.
If price breaks and holds above the 200 MA shown on the Daily ratio chart below of EEM:SPX, we may finally see a recovery on the horizon. Otherwise, look for extreme weakness if price falls and holds below the 50 MA.
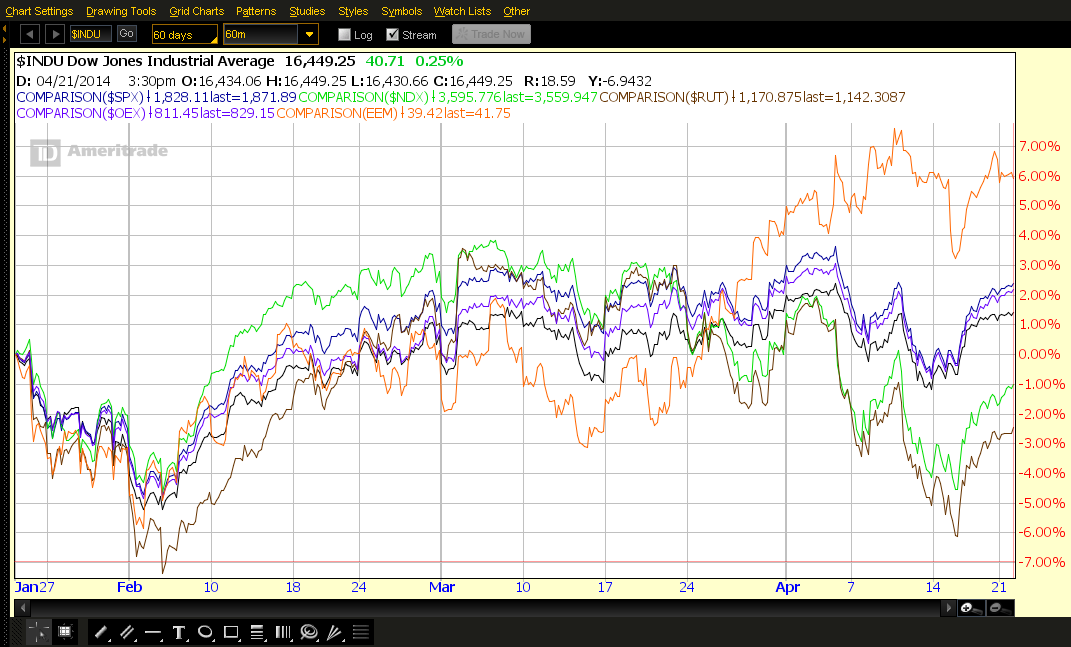
The following 60-day 60-minute comparison chart of the Major Indices vs EEM shows that recent buying in EEM has outpaced the majors…one to watch to see if that risk pattern continues.