
The following 1-year Daily charts are simply presented to show trend, support and resistance levels, and current price levels for the past year for a variety of U.S. Major Indices & Sectors, World Indices, Commodities, Forex pairs, and U.S. social media ETF & stocks.The accompanying 1-year percentage-gained graphs show the leaders and laggards for those groups.
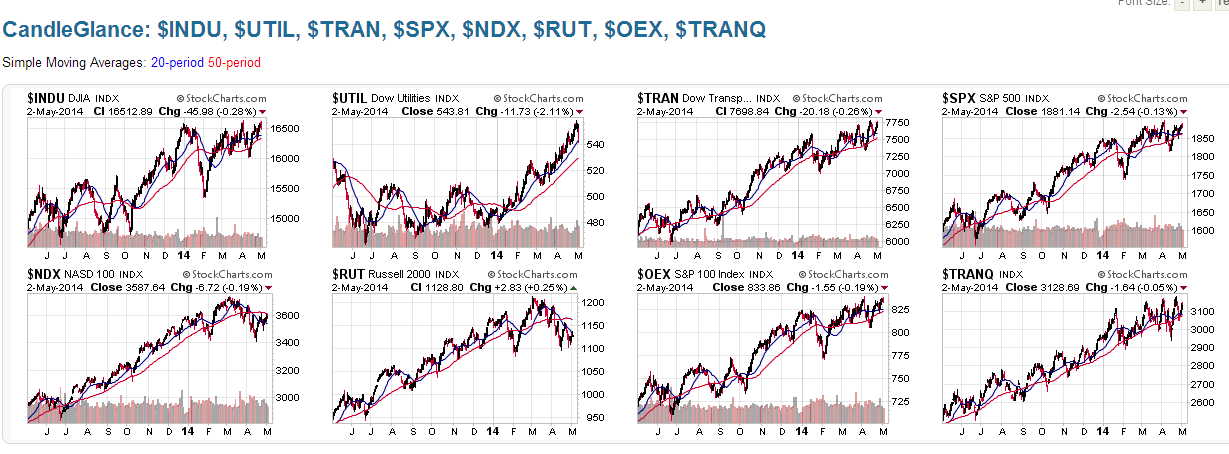
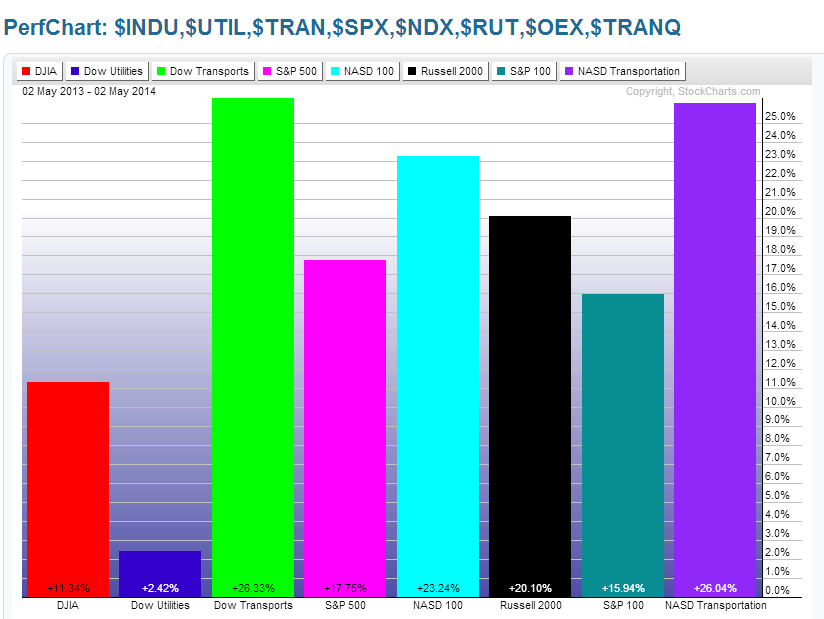
Major U.S. Indices
Dow Transports and Nasdaq Transports are the clear leaders based on price performance and percentage gained over a one-year period, while Dow Utilities lags on percentage gained during that same period (even though it has outperformed in 2014). The Nasdaq 100 and Russell 2000 Indices are the ones to watch to see if recent weakness persists…if so, they may negatively influence and drag down the others. However, if we see the Dow and the S&P 500 begin to rally and hold above their near-term resistance levels, and if the Nasdaq and Russell still decline, it may simply mean a rotation out of risk and into value sectors and stocks. Looking at the percentage-gained graphs on a weekly basis will reveal the short-term trend.
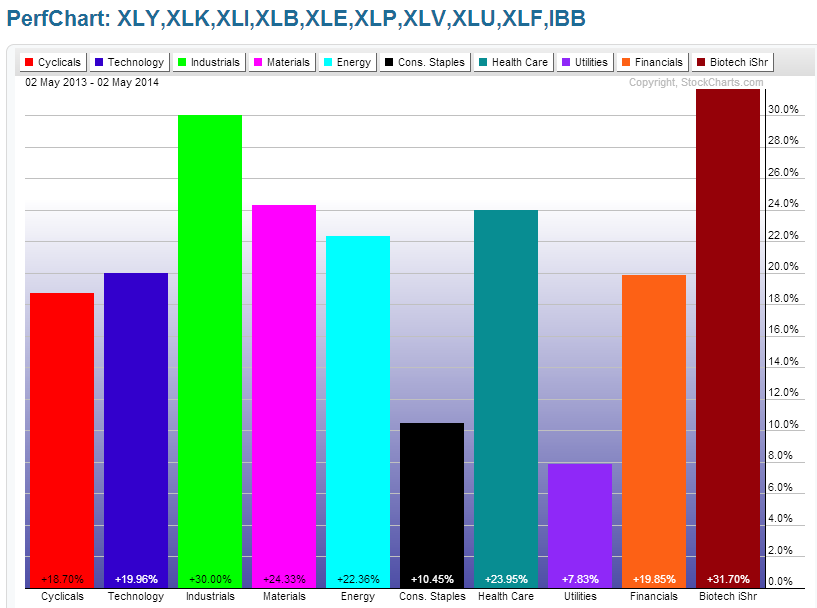
U.S. Sectors
Although Biotech is not one of the 9 Major Sectors, I’ve included it to illustrate that it’s leading, along with Industrials, while Utilities lags in terms of percentage gained (notwithstanding its relative outperformance in 2014). I’d keep an eye on Energy, Consumer Staples, and Utilities to see if they maintain recent upward momentum.

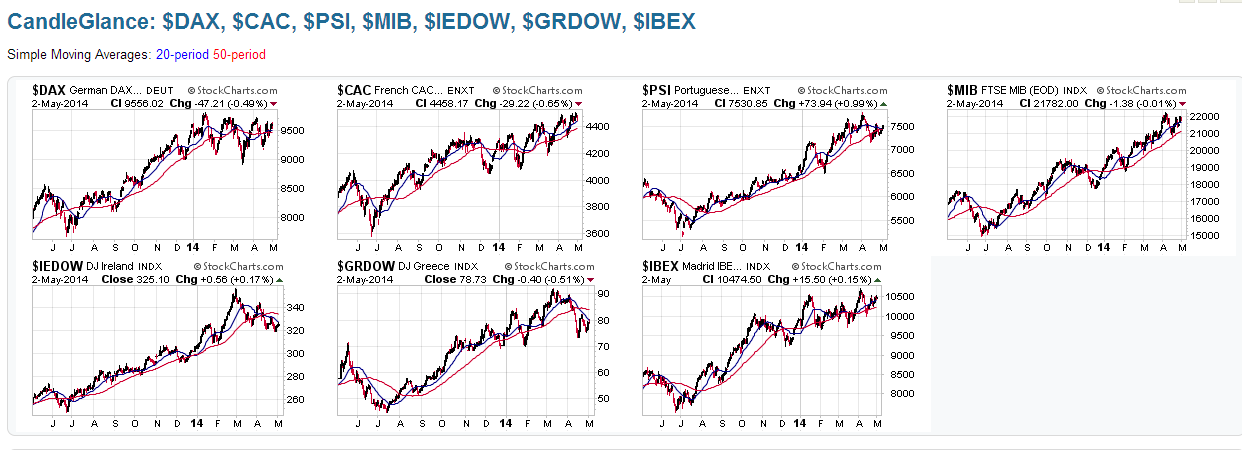
Germany, France & PIIGS Countries
Greece is the leader on a one-year percentage-gained basis (notwithstanding its weakness in 2014), while France is the laggard. Europe is mixed and its near-term performance may be tied in with the situation in the Ukraine…we may see hints of direction for these within the Energy and Commodities groups.

Emerging Markets ETF & BRIC Countries
The Emerging Markets ETF is flat, while India is the leader on a percentage-gained basis. Russia is the laggard…it bounced in March after setting a 3-year low and is caught in recent chop just below major (3 year) resistance…we’ll see what happens in the Ukraine and how it affects this index. China is also a major laggard and is sitting at major (3 year) support…one to watch, along with the Aussie $ and Copper.


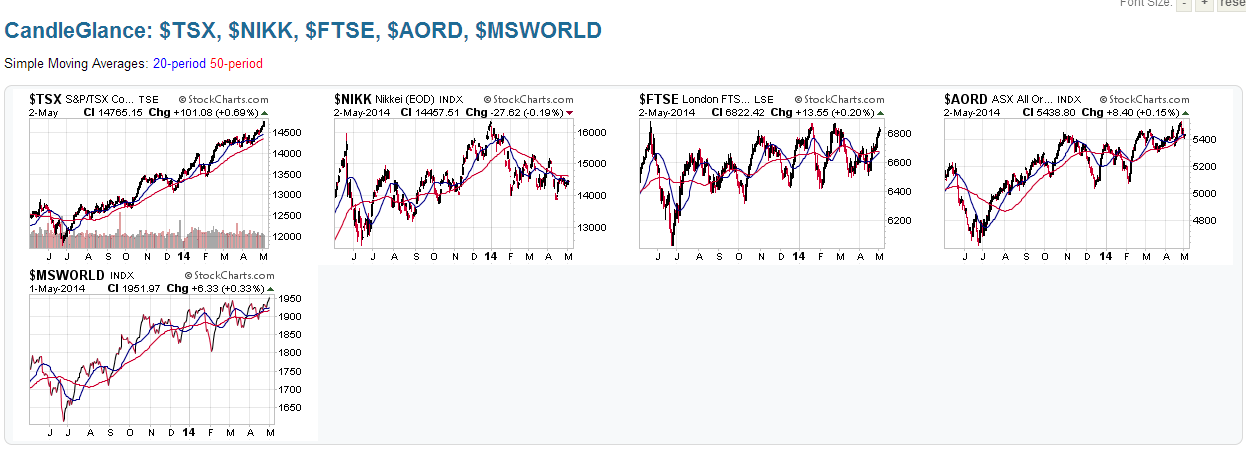
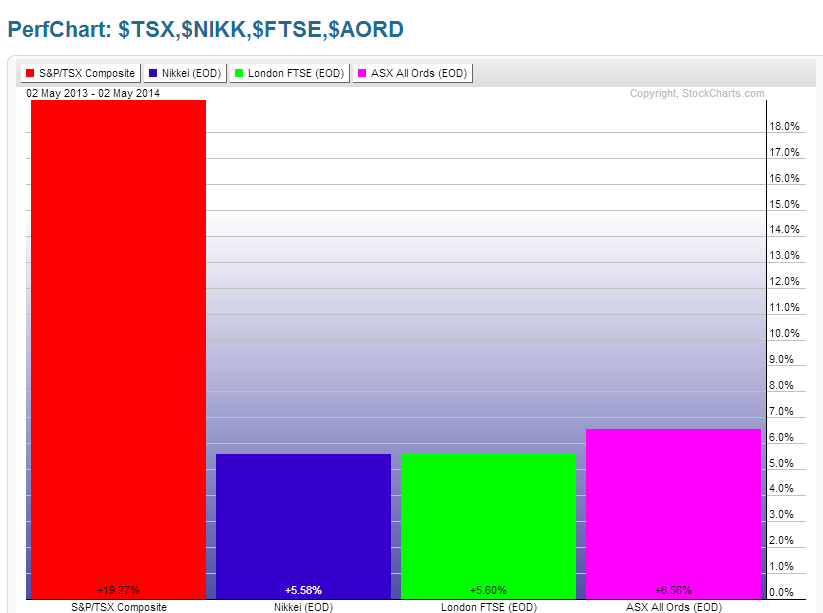
Toronto, Japan, London, Australia & World Market Indices
Canada’s TSX Index is the leader, while Japan, London, and Australia are, essentially, tied, on a percentage-gained basis for the past year. Further strength in Energy and Commodities may continue to support price in Toronto’s Index.
Commodities, US $ & US Bonds
The Agricultural ETF (DBA) has gained the most, while Silver has lost the most on a percentage basis. As I mentioned in my post of May 2nd, Gold, Silver, Copper and DBC are at major support levels and may be poised for a hard rally.


Forex Pairs
The British Pound has gained the most, while the Aussie Dollar has lost the most. The U.S. Dollar is sitting at/above major (3 year) support and may also be poised for a hard rally, as may 30-Year Bonds, which is now sitting just above major (3 year) resistance (as shown in the above chart grouping).


U.S. Social Media ETF & Stocks
Facebook is the leader, while BlackBerry has lost the most. Twitter, is below its IPO price. Further weakness in the Social Media group may, ultimately, drag Facebook down; however, the others are sitting at/near major support, so we’ll see if traders start accumulating positions in those stocks and ETF.


Have a great weekend and best of luck next week! Another post for Google Earth. 😉
