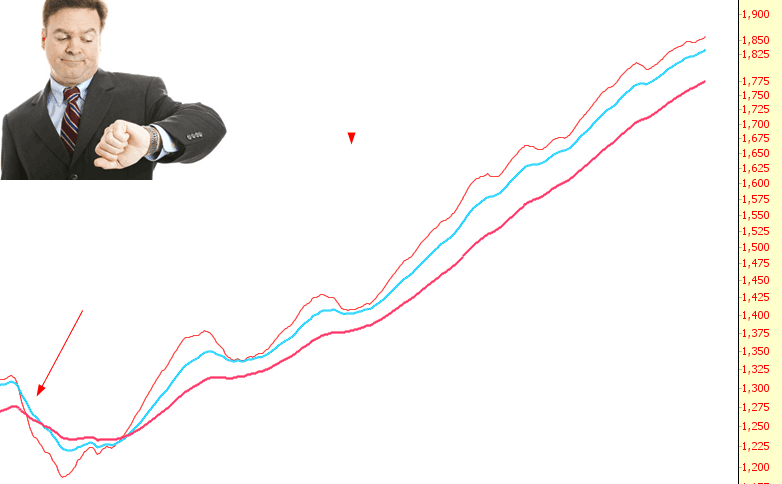
Early this week, on Monday morning, the market was melting like an ice cream cone on a summer’s day. It was glorious. Of course, that only lasted for a couple of hours. I had forgotten what that feeling was like, though – – where stock prices just slip without any bids. But as the chart below illustrates, there’s a reason such a feeling is as rare as hen’s teeth: the last time the market had honest-to-God weakness was nearly three years ago; as the exponential moving averages (in this case, on the S&P 500) illustrates, it’s just been a steady drift higher.
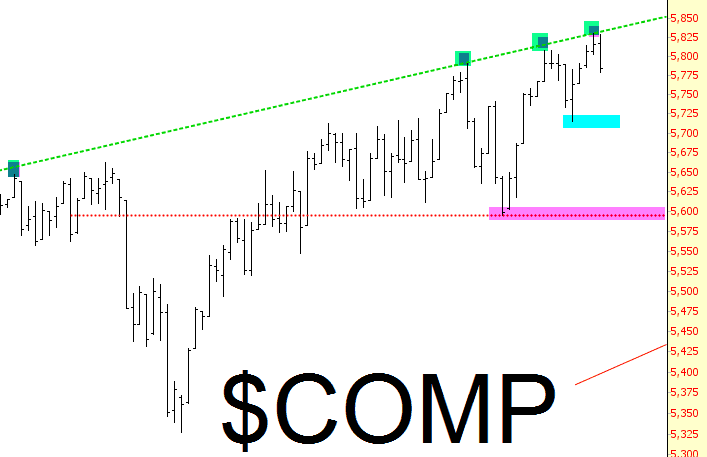
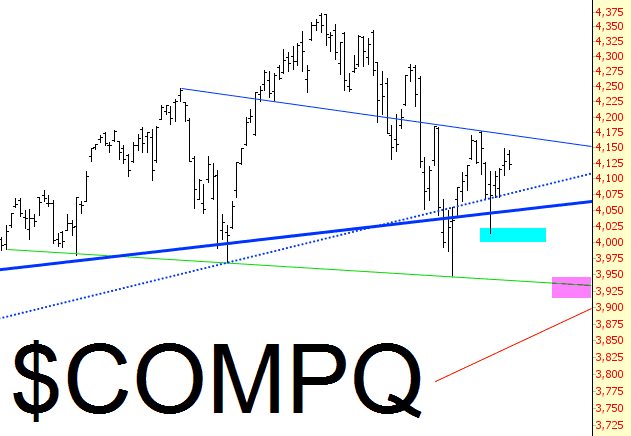
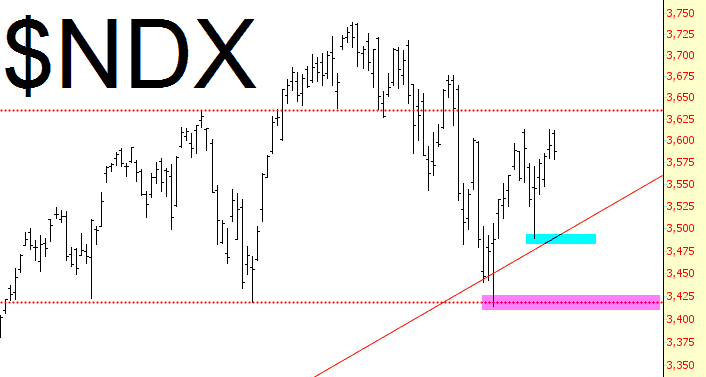
There are some levels near-term, however, which – if broken – offer the bears some hope. I’ve marked two places in each chart: a cyan tint for a “nice, but just a first step” price failure, and a magenta tint for “good, now we can get serious about dining on bull meat” price failure. Also, in the first chart, I’ve accented how daintily the prices have been tagging the ascending trendline that defines resistance.