I usually look at 10 year daily charts. Day after day, I examine thousands of these things. Earlier today, I decided to glance at the longer-term picture of a couple of important indexes. Below are the 20-year charts of, respectively, the Dow Jones Composite and the NASDAQ Composite. Click on each one to see the larger version. (more…)
Slope of Hope Blog Posts
Slope initially began as a blog, so this is where most of the website’s content resides. Here we have tens of thousands of posts dating back over a decade. These are listed in reverse chronological order. Click on any category icon below to see posts tagged with that particular subject, or click on a word in the category cloud on the right side of the screen for more specific choices.
Segment Two
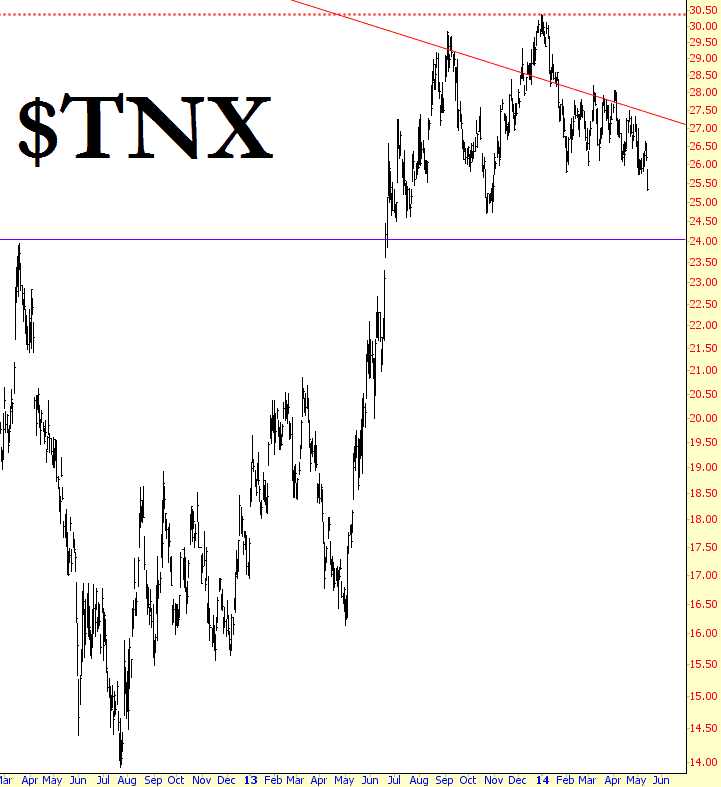
Interest Rate Free-Fall
Looks like the Fed’s gradual departure from being a massive bond buyer isn’t hurting interest rates. Indeed, they are slip-sliding away. Interestingly, sectors that would normal benefit from this continued collapse (home builders, for instance) are sinking as well.
Swing Trading Watch-List: TIF, IR, HAL, CTXS, FSLR

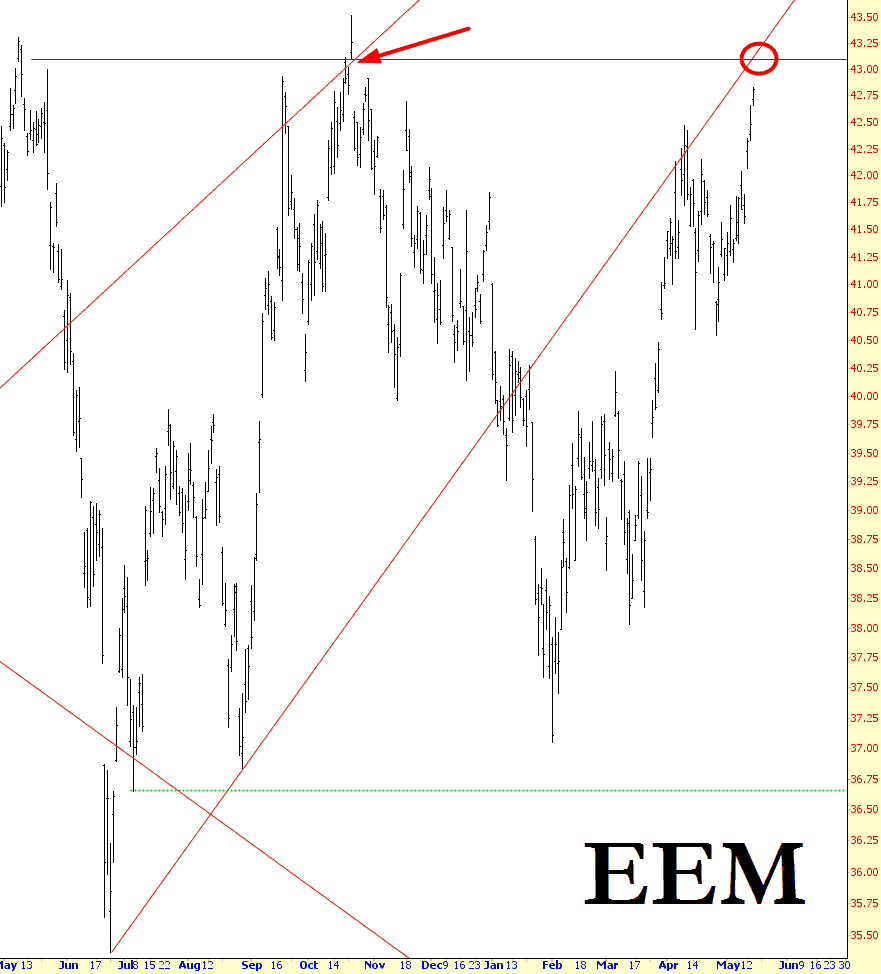
Gap Closing on Emerging
How’s that for a confusing post title? Anyway, I am so short, I could jump off a dime, and I am merely adding to positions. The latest of the emerging markets ETF, symbol EEM, which is approaching a gap-fill as well as the underside of a trendline.