
Just a short post on SPX only today as I have work being done on my internet setup this morning.
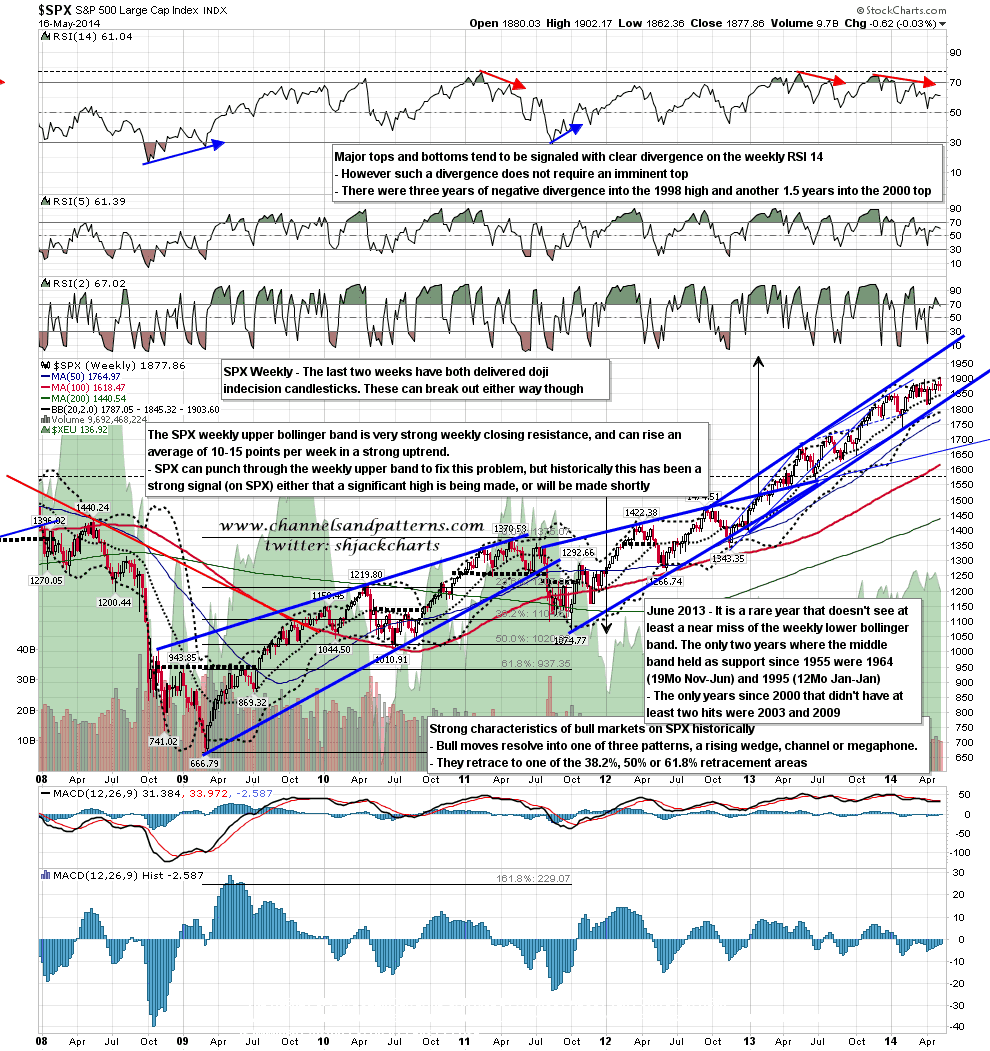
For the second week the weekly candlestick on SPX was a long legged doji. These are indecision candlesticks, but don’t give any clues to direction as the breakout direction is random. If we see a break up then the weekly upper band is currently at 1903.6, close to a retest of the current high, and on a break down the middle band is currently at 1845, slightly under rising support from the 1737 low. SPX weekly chart:
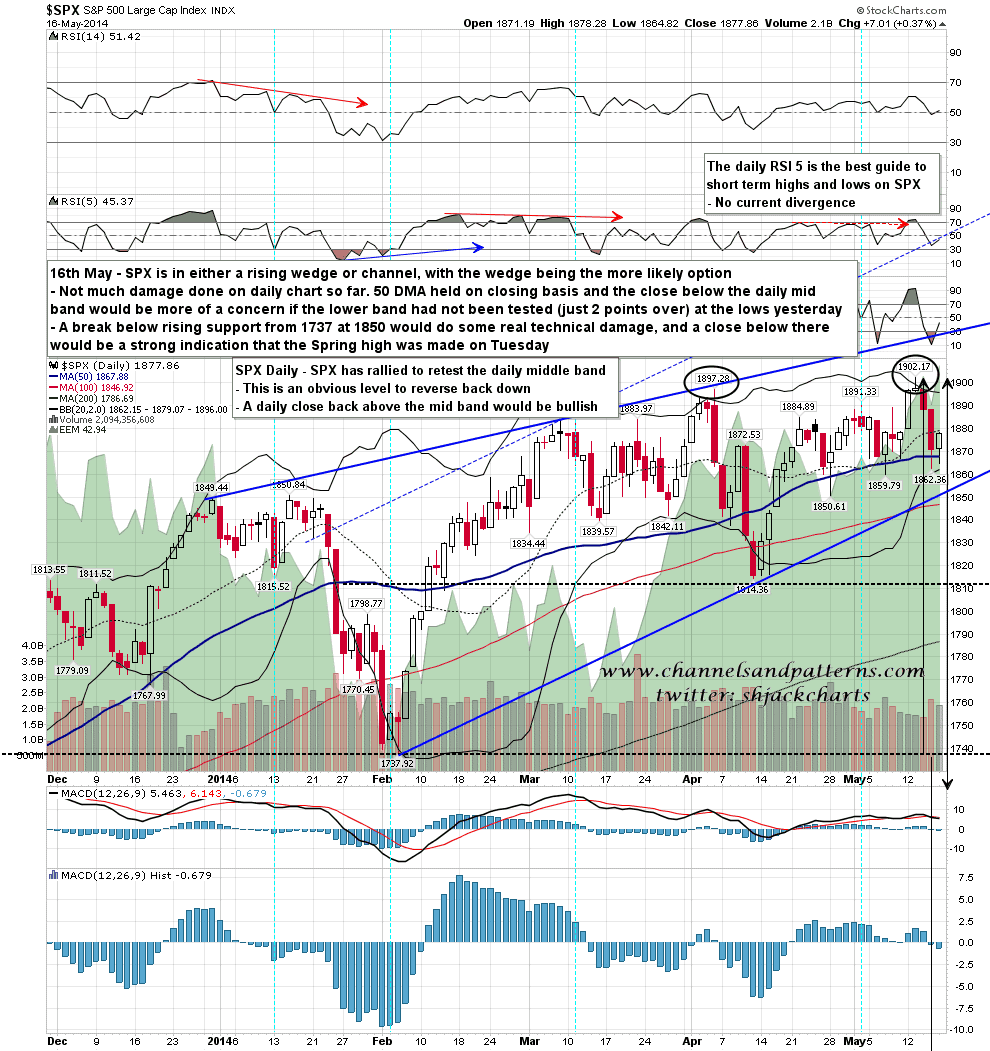
On the SPX daily chart the rally on Friday afternoon retested the daily middle band, and the close just just underneath it. A break with a daily close more than 4 points back above the middle band would be bullish. Worth noting here is the now very narrow daily bands, which is telling us the we are likely to see a move start shortly that will hit an outside band and then rise the band in a powerful; move for several days. The last similar pinch was in January and was resolved in the fast move down into the 1737 low. SPX daily chart:
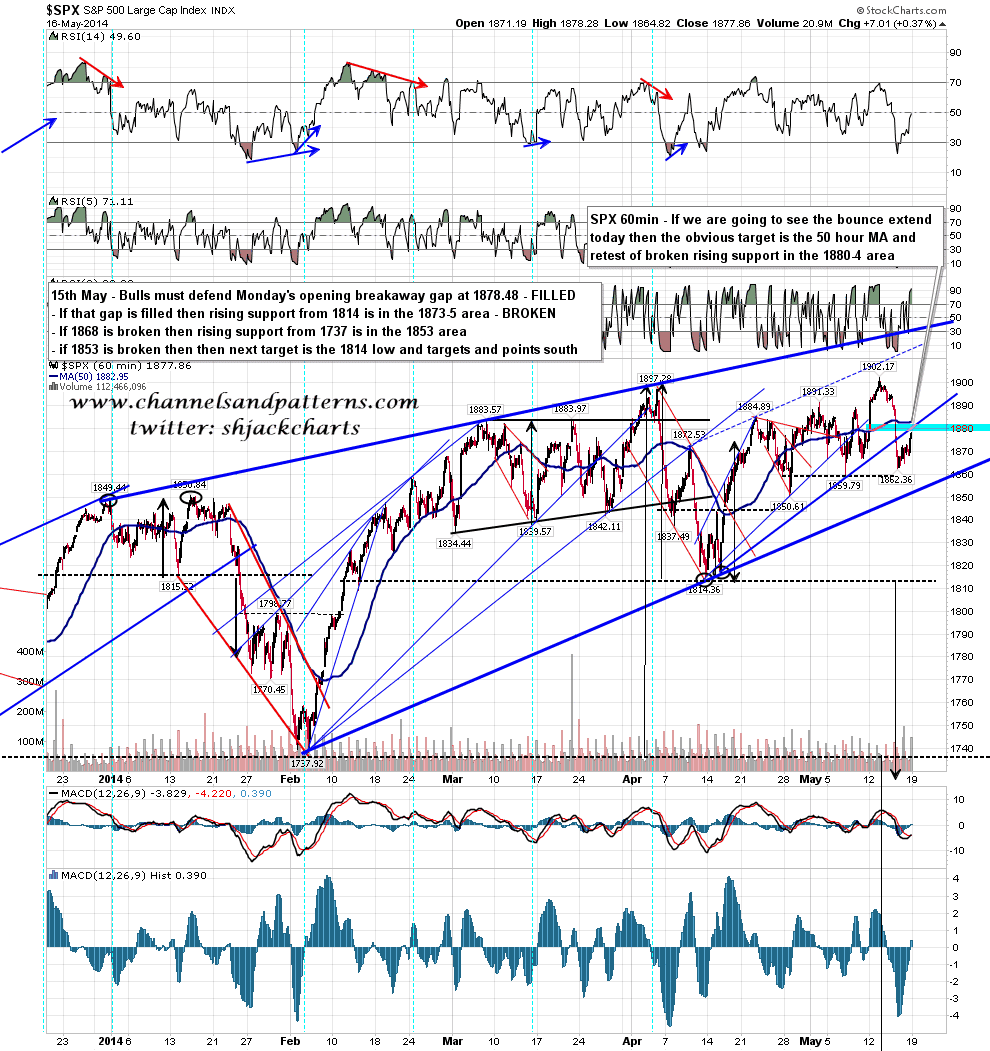
If we are to see further downside then a natural place to see that start is at the retest of the daily middle band, so we may well see a move down resume today. If we see some more upside then there is obvious resistance in the 1880-4 area at broken rising support from 1814 and the 50 hour MA at 1883. A break back over the 50 hour MA would be bullish. SPX 60min chart:
This could break in either direction, but my lean is bearish, and I’m expecting to see this rally fail either at the middle band test or at the 50 hour MA test. I could be mistaken however. A break below the last significant low at 1859.79 would be bearish, and a break below 1850.61 should confirm a break downwards. whichever way the next break goes it will most likely break hard and run some distance.
