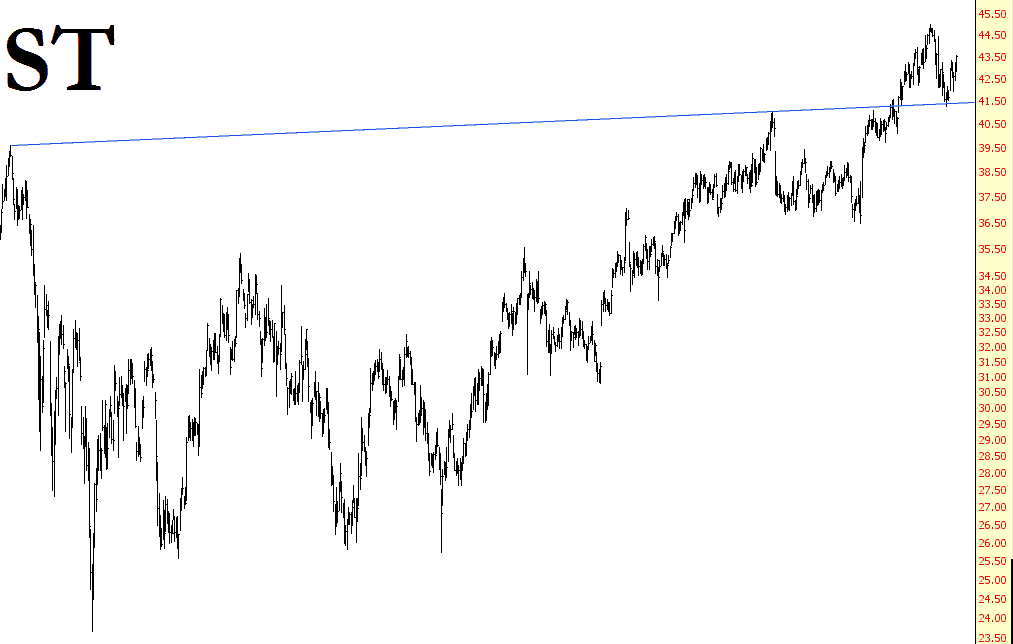
It’s been a long time since I’ve mentioned any “long” idea at all, so – – time to break the drought:
Slope initially began as a blog, so this is where most of the website’s content resides. Here we have tens of thousands of posts dating back over a decade. These are listed in reverse chronological order. Click on any category icon below to see posts tagged with that particular subject, or click on a word in the category cloud on the right side of the screen for more specific choices.
It’s been a long time since I’ve mentioned any “long” idea at all, so – – time to break the drought:
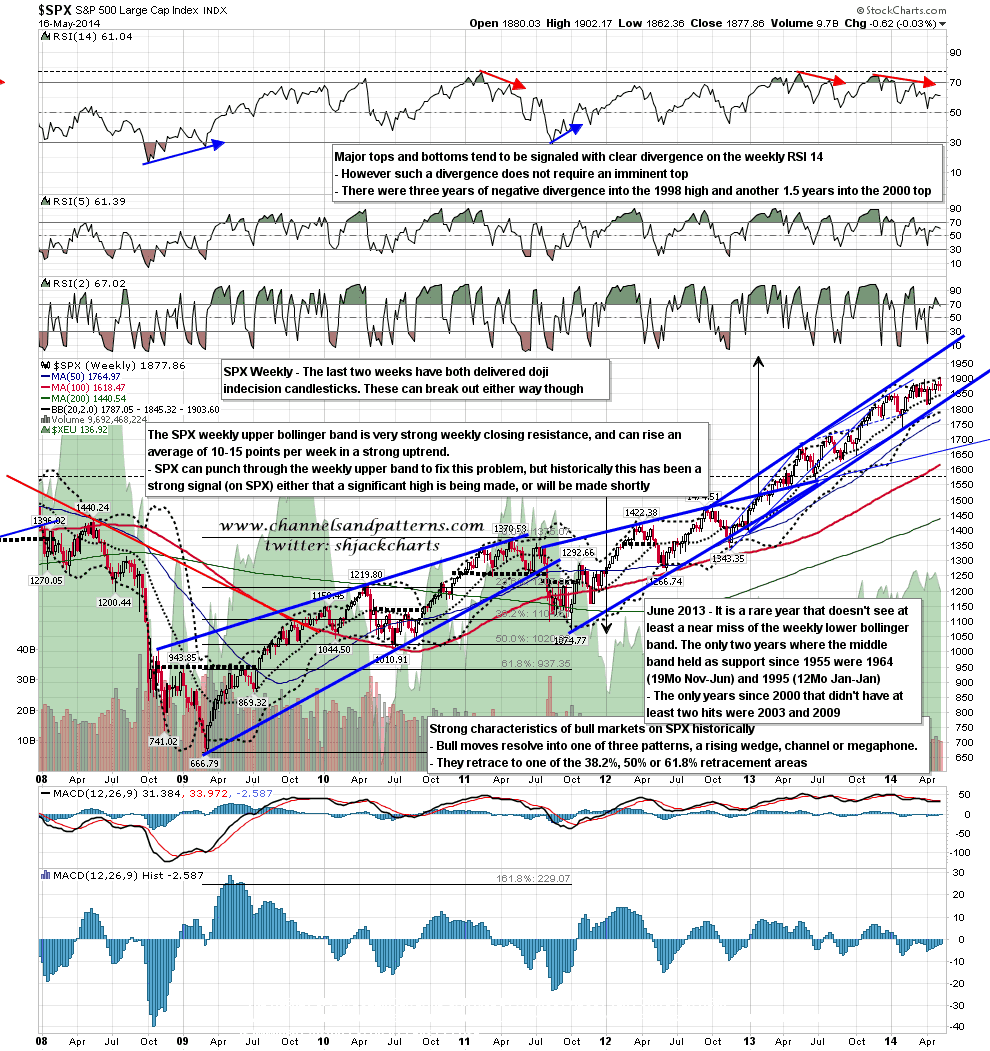
Just a short post on SPX only today as I have work being done on my internet setup this morning.
For the second week the weekly candlestick on SPX was a long legged doji. These are indecision candlesticks, but don’t give any clues to direction as the breakout direction is random. If we see a break up then the weekly upper band is currently at 1903.6, close to a retest of the current high, and on a break down the middle band is currently at 1845, slightly under rising support from the 1737 low. SPX weekly chart:
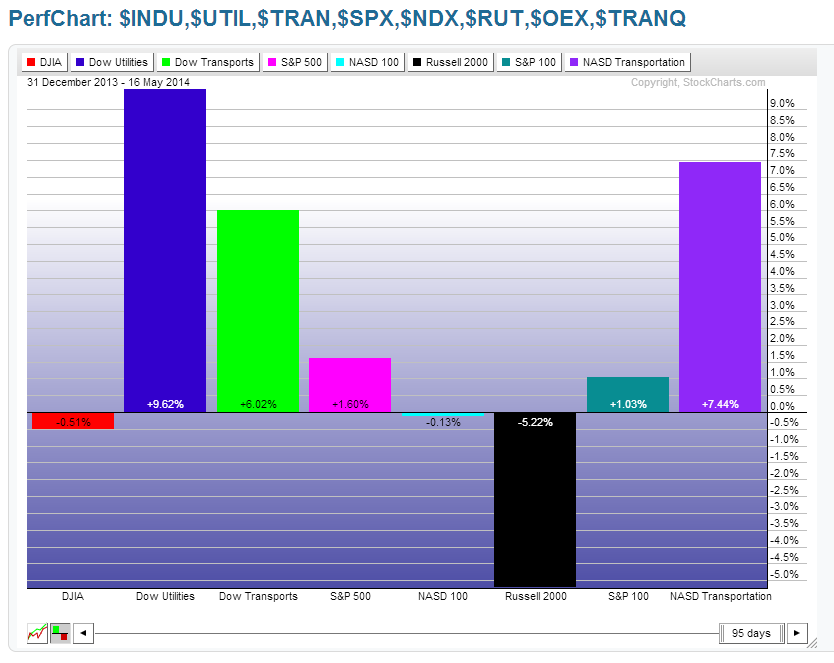
The following Year-to-date percentage gained/lost graph of the Major Indices shows that the Small Cap Index (Russell 2000) has dropped by 5.22% since January 1st of this year…a significant variance from the others.