
I have been posting charts every so often over the last year or so talking about the end of the bear market on precious metals, which either ended in 2013 and is now waiting for confirmation of that , or should end sometime over the next few months. As and when a new bull market is confirmed I’ll be expecting the precious metals sector to be a very nice earner over the course of the next bull market there.
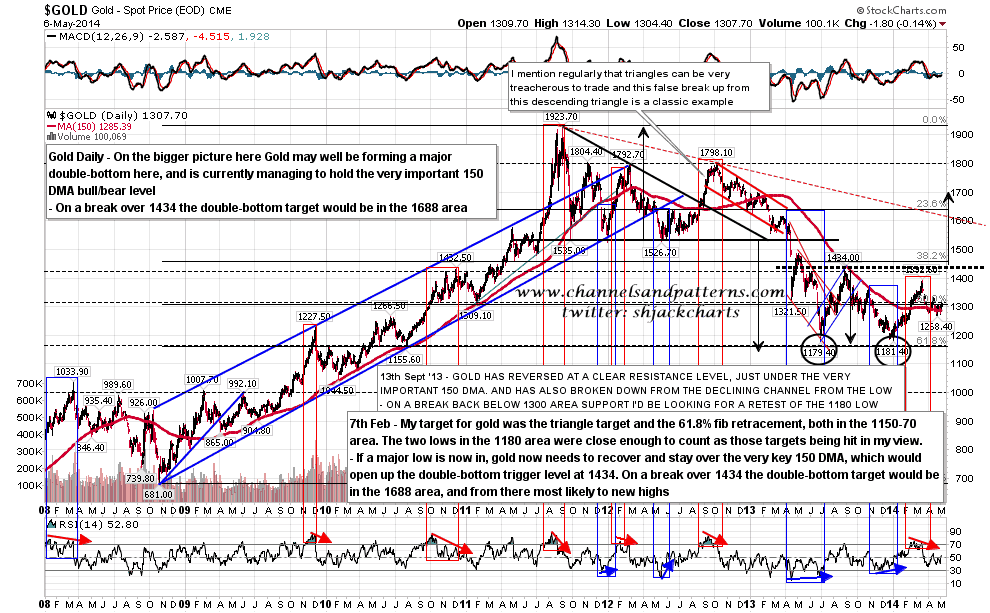
On the gold chart there is good reason to believe that the bull market low may be in. Gold was close enough to the triangle target for government work, just missed the 61.8% fib retracement of the bull market from the late 2008 low, has been trading back above the very key bull/bear dividing 150 DMA, and has a part formed double-bottom that would target the 1688 area on a clear break over 1434. Gold daily chart:
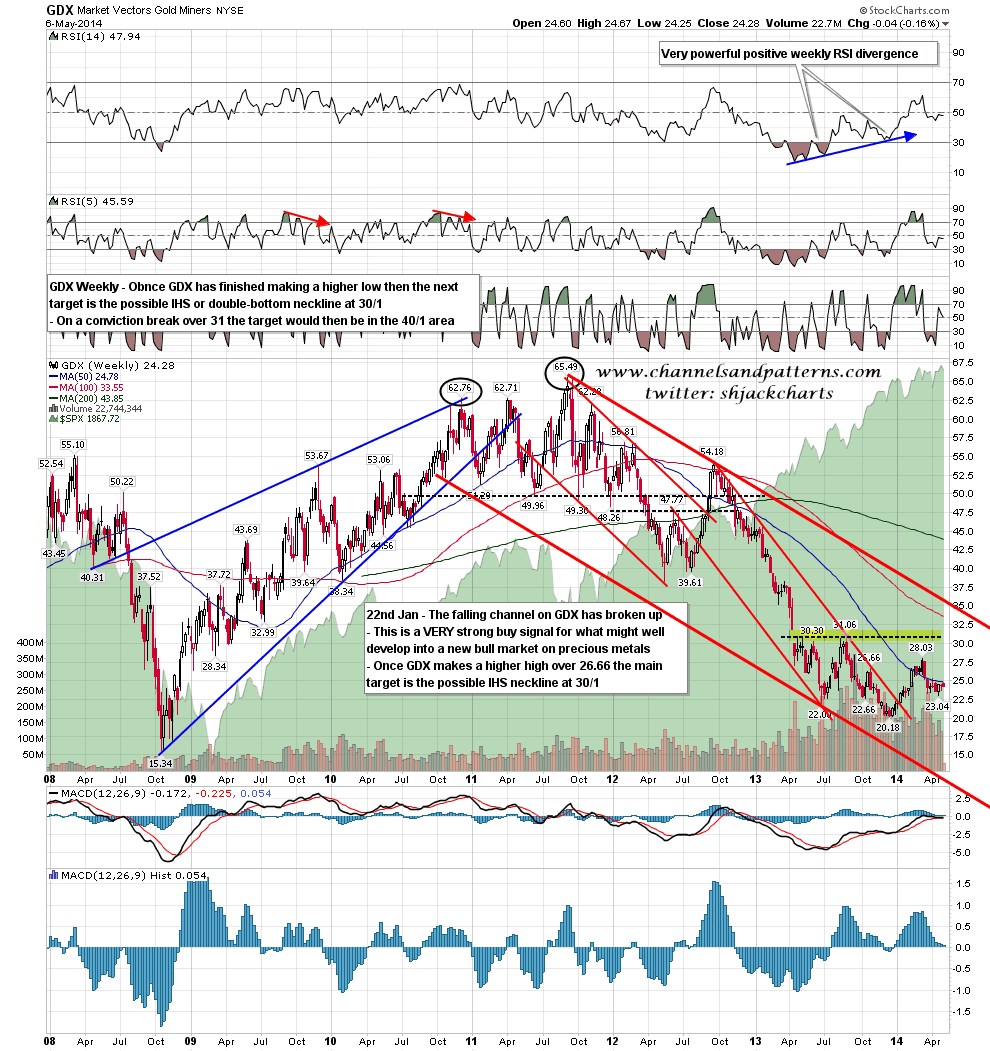
The GDX chart is still more bullish, with huge weekly positive RSI divergence at the lows, and what should be either a double bottom or IHS forming after the last falling channel broke up. The next obvious target is a test of 30/1, and on a clear break over there the target would be in the 40/1 area. I would mention on the bear side though that there was a huge H&S on this chart that I haven’t marked up, but which targets the 13.5 area, and that target would now be within the overall fallling channel from the 2011 high. GDX weekly chart:
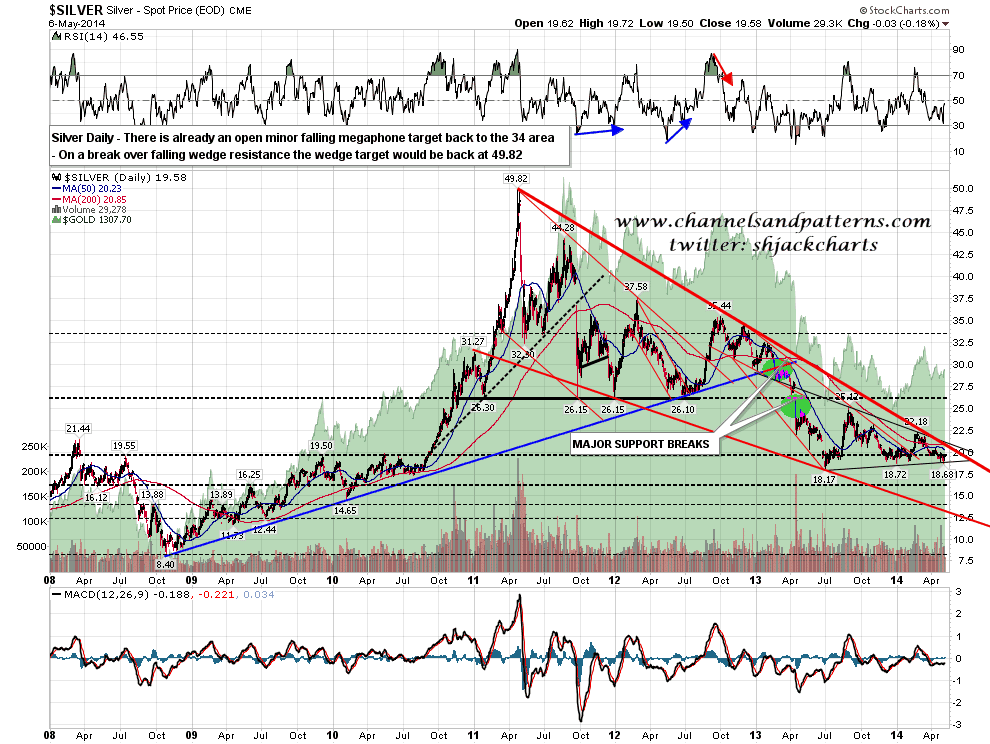
On the silver chart a huge falling wedge has formed from the 2011 high, and that is the primary pattern from that high that is closest to breaking up. I have falling wedge resistance in the 21 area and as and when this pattern breaks up the wedge target will be a retest of the 2011 high at 49.82. The short term pattern is a triangle and if this breaks down that could signal a move to falling wedge support, currently in the 12.5 area, but I would expect at least a precise touch of falling wedge resistance before another move down. Any break up should be a strong long signal as it could not be a bearish overthrow, as if this pattern was to resolve downwards, the target would be in the -$40 area, which seems unfeasibly low. Silver daily chart:
So why the post on precious metals this week? Well I had been expecting some more downside after the March high, and for the daily RSI 14 to reach at least the 30 level, and that may still happen, but an alternate scenario would be that this retracement could bounce at the very important 150 DMA, which is strong support and would be an excellent technical level to break back up. This may be happening.
Now I have mentioned many times that I don’t like triangles, as they often make a false break in one direction before resolving in the other, or indeed make false breaks in both directions before resolving in the original break direction. With that caveat there is a very interesting set on the 60min GLD chart where a large descending triangle has broken up and retested broken triangle resistance today.
If GLD can hold above broken triangle resistance, then another push up should trigger the nested double-tops I’ve marked on the chart below, and take GLD to retest the March rally high. If GLD could then make a higher high over the March high I’d be inclined to take that as firm confirmation that precious metals were back in an overall bull market. GLD daily chart:
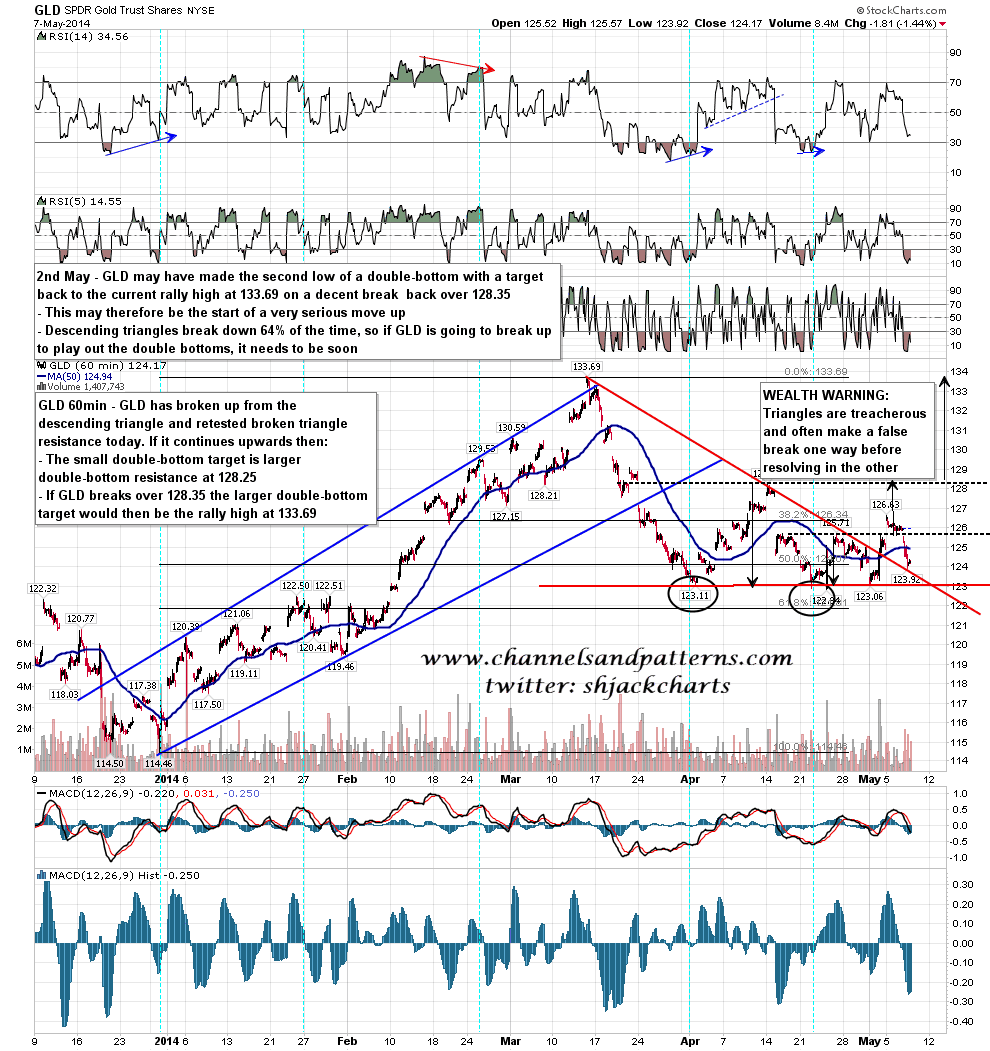
This is most definitely not a low-risk trade, as no trade with triangles is a low risk trade in my experience, but it is a good risk/reward trade. If GLD can now hold above broken triangle resistance then there is a very decent chance that gold will beat its 2011 high before there is another break under that triangle support. I’ve bought some gold futures on spec, and I’ll be adding if the setup grows stronger.
