
Having lost new data a few days ago, stockcharts appears to been down altogether this morning. Hopefully this isn’t becoming a regular thing. I’ve managed to locate enough charts for the post this morning as I tend to post quite a few charts during the day, and I have picked three that I posted yesterday for this morning.
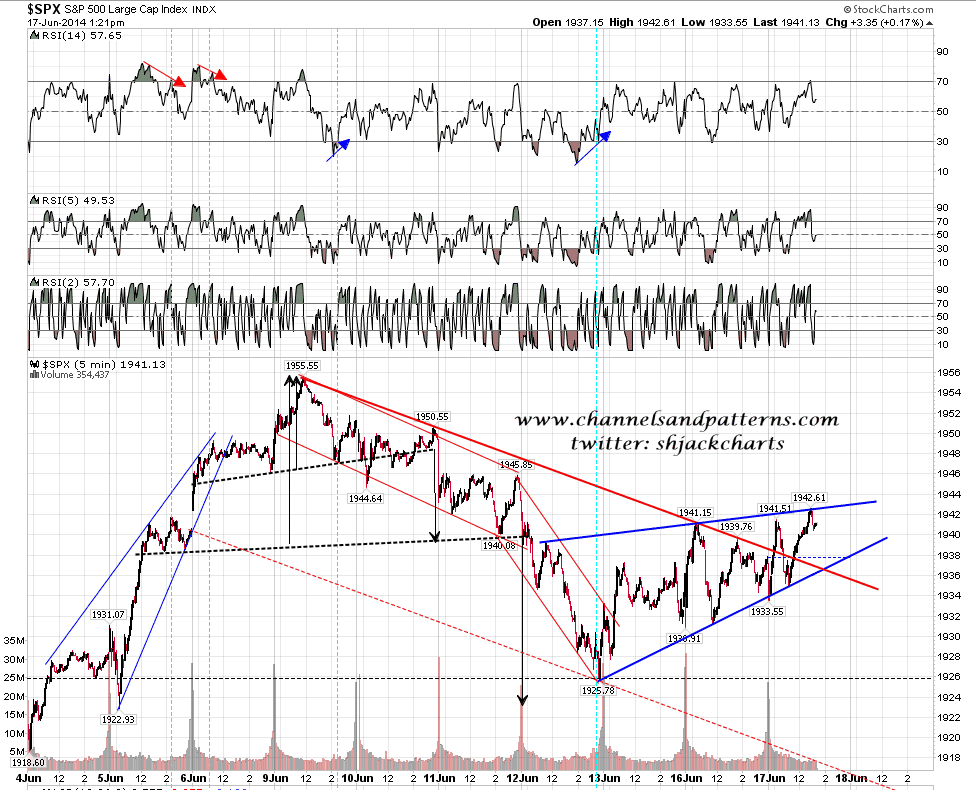
The first chart I posted on twitter yesterday afternoon, and it shows the rising wedge on the SPX 5min chart. This overthrew twice before the close and although this is a 70% bearish pattern targeting a retest of the lows on a break down, it may be that this one is going to take the 30% odds route and break up with a target in the 1960-5 area. SPX 5min chart (Tuesday PM):
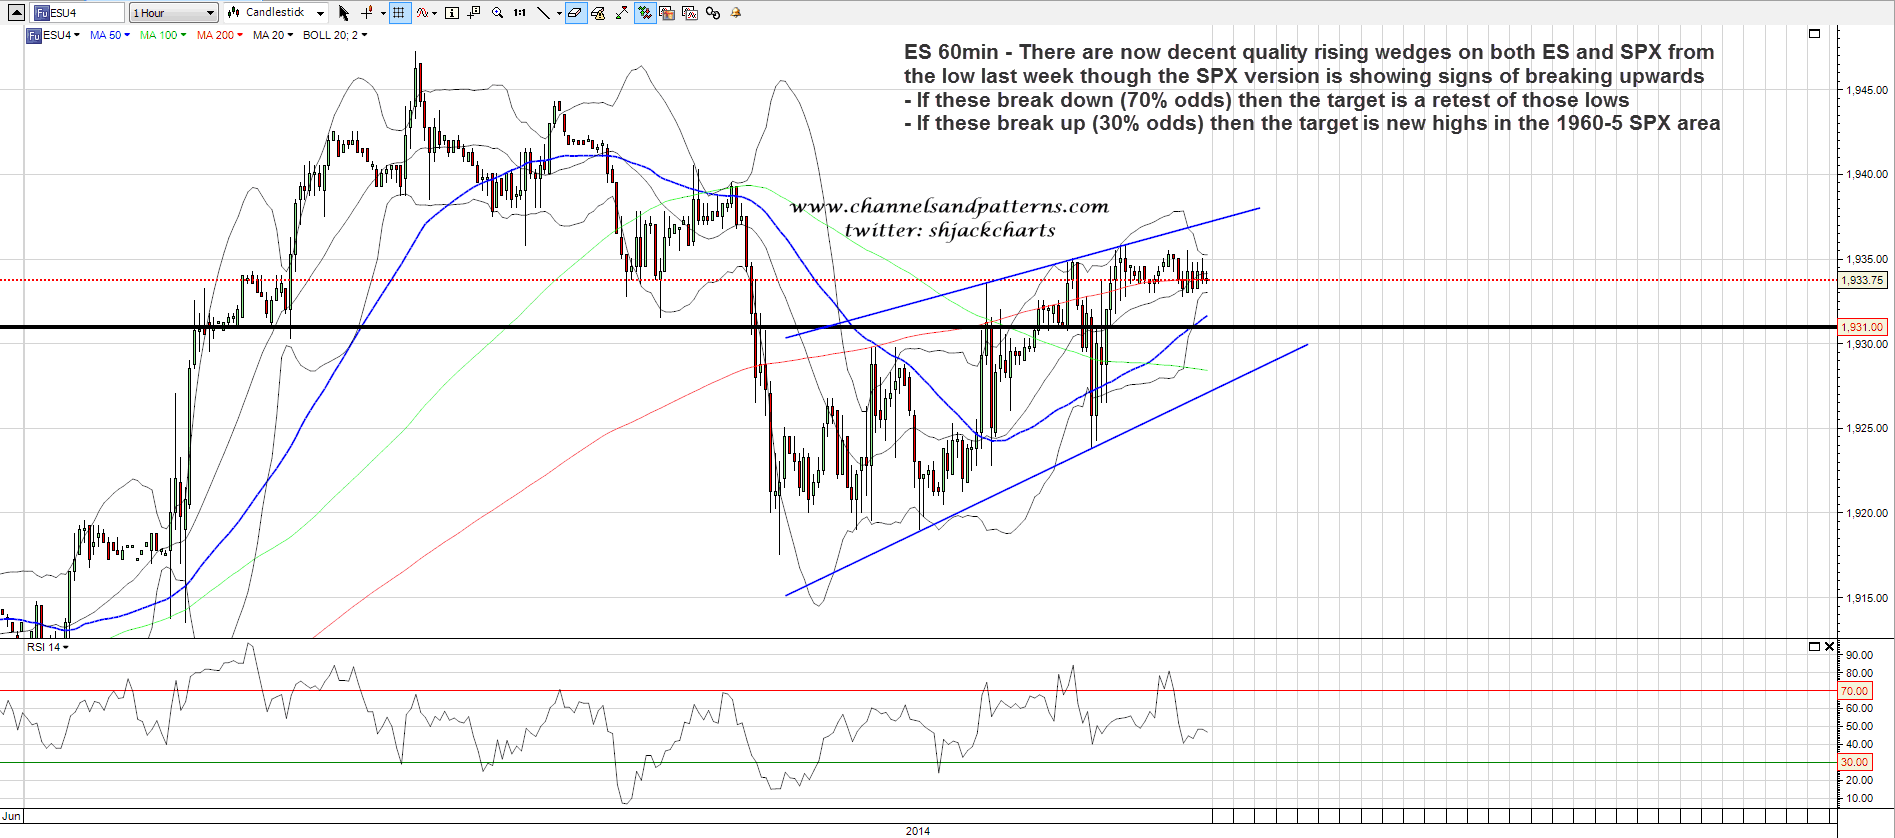
There is a matching rising wedge on ES, with the support trendline in the 1927/8 area this morning, and one way or the other I suspect strongly that this wedge will break out today. ES 60min chart:
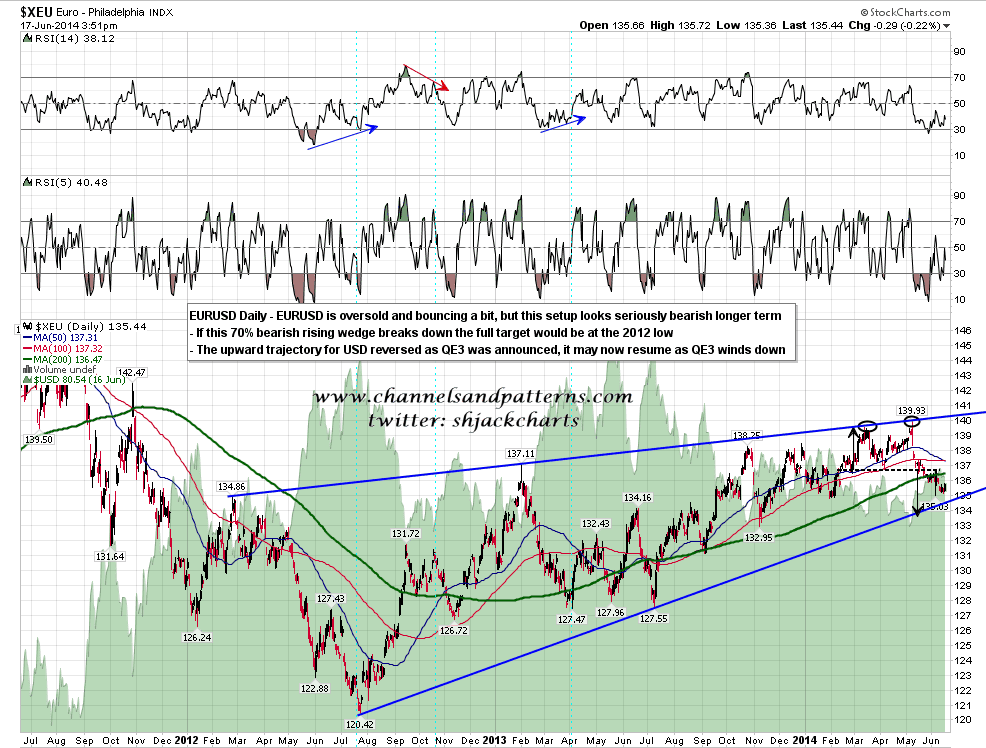
I was showing a trading bud my bigger picture view on EURUSD yesterday evening, and that is my rising wedge from the 2012 low. EURUSD is bouncing slightly at the moment but I’m expecting at least a touch of rising wedge support in the 1.345 area on this current move down. EURUSD daily chart:
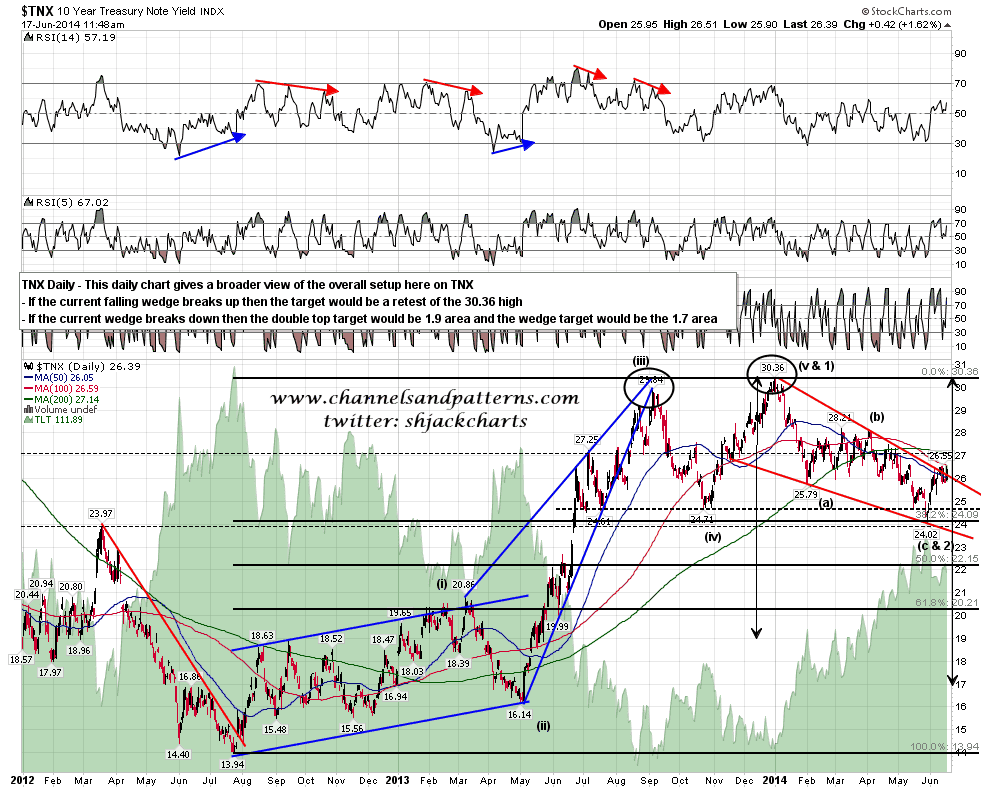
I have been bullish bonds and bearish bond yields all year but I’m starting to lean the other way now. There is a very nice looking bear setup here on TNX on a break below the falling wedge but there are a couple of reasons why I think TNX may just break up here instead. One of those reasons is that falling wedges are 70% bullish patterns of course, and the natural direction for the next break is therefore upwards.
Another reason is that the 2012 low had a very good chance in my view of being the final low for the bear market in bond yields from 1980. From an EW perspective there would then be a five part wave 1 up, a three part wave 2 retrace that would most likely bottom near a significant fibonacci retracement level, and then a wave 3 up. There seem to be a clear and very typically formed five waves up for wave 1, and then three clear waves for the retracement from that so far, bottoming almost exactly at the 38.2% fib retracement of wave 1. If that count is right, and though I’m no EWer I do know the basics, then wave 3 up is starting and TNX will break up here towards infinity and beyond.
If that turns out to be the case, take a good look at bond prices at the current level, as you may not see these levels again in your lifetime. Bull and bear markets on bonds tend to last two or three decades and if the next bear market on bond yields is as powerful as this one, then we might see similar prices again somewhere in the 2060-70 time range. TNX daily chart with count:
Yesterday afternoon SPX recovered above the 50 hour MA and held it as support. Unless that changes this morning the bulls have the advantage and the rising wedges on SPX and ES may well be about to break up. If bears can break back below that and stay below it then the odds will favor a retest of the lows as rising wedges break down 70% of the time. FOMC today of course, and that may be a market mover even if the Fed just trims QE3 by another $10bn per month as expected. Which way will FOMC push equities? Unfortunately my crystal ball is at the cleaners so we’ll just have to wait and see.
