
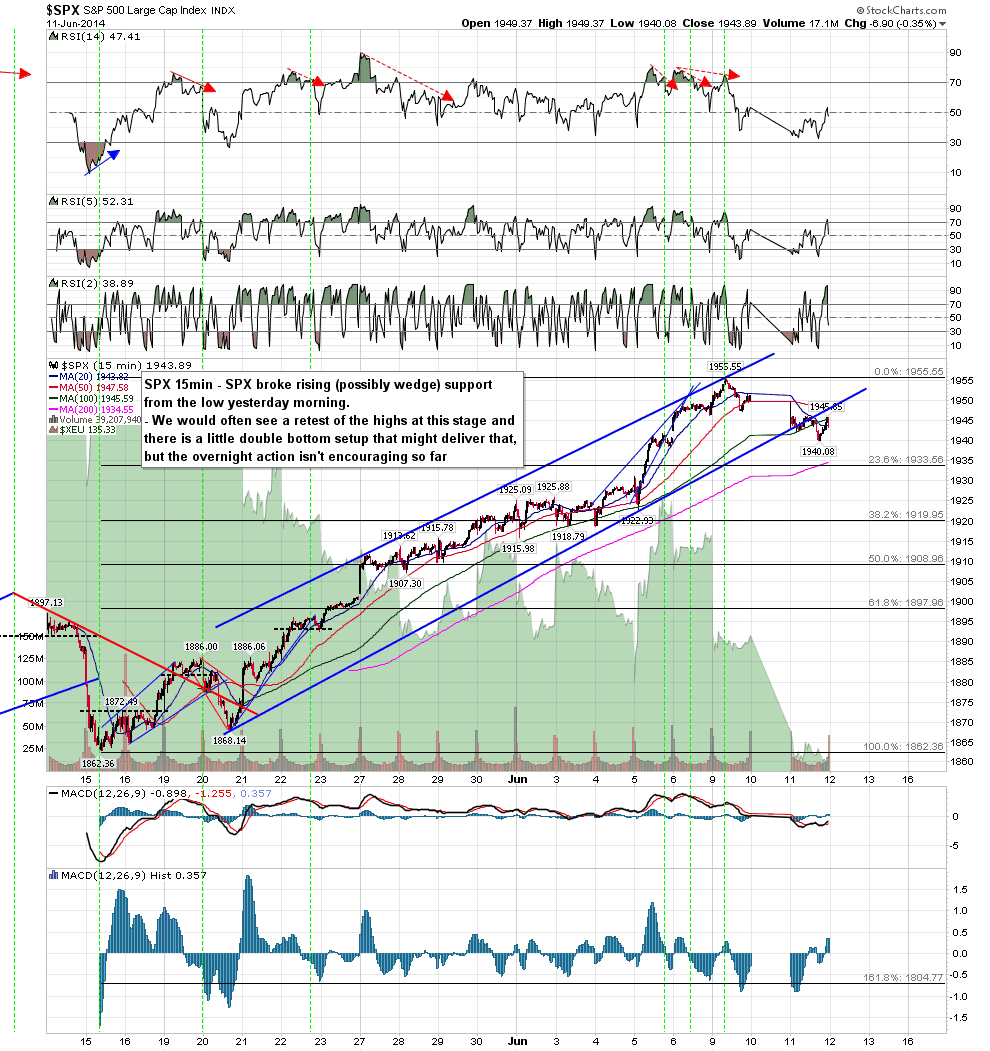
SPX confirmed the rising support support trendline from the 1862 low area yesterday morning and then broke down through it. A little double bottom setup developed yesterday afternoon that suggested a possible retest of the highs, but the overnight action has not been promising for that playing out. SPX 15min chart:
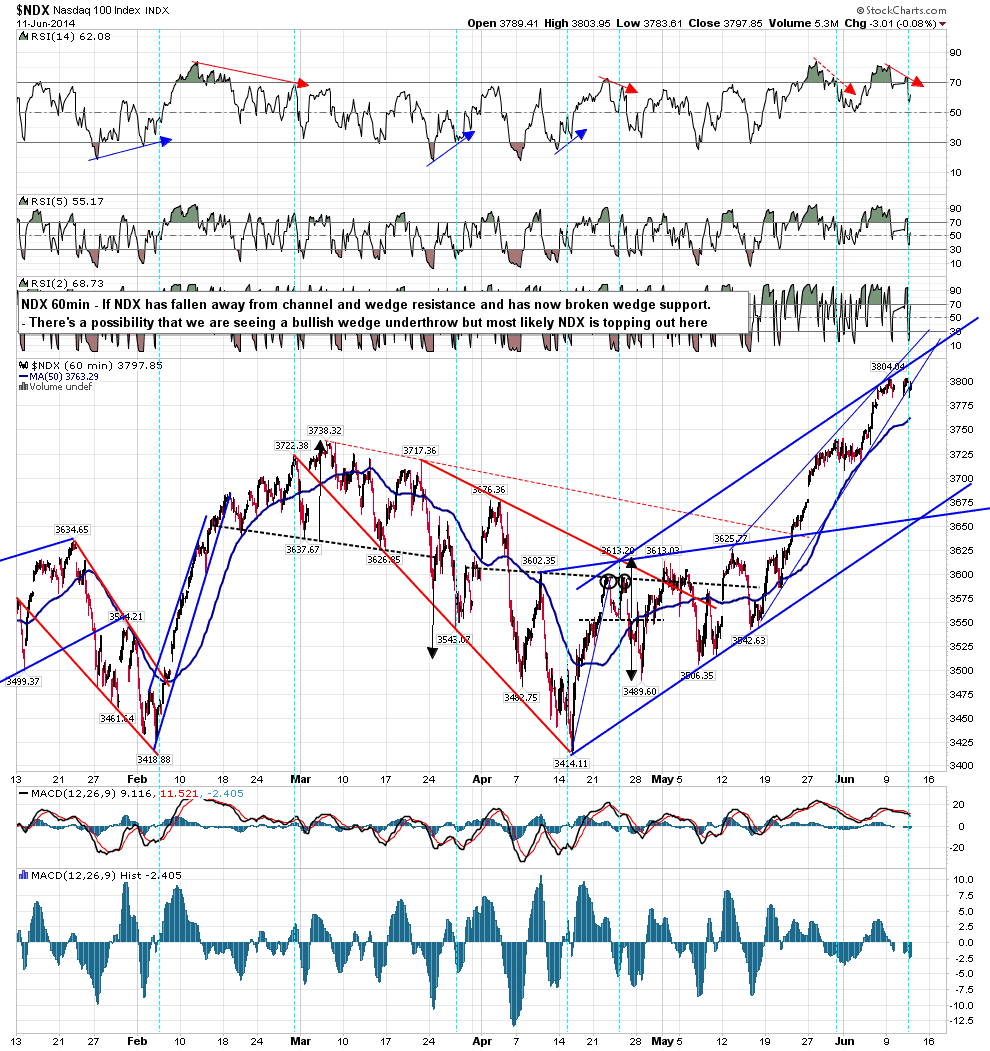
NDX has finally fallen away from rising channel and smaller rising wedge resistance, and broke rising wedge support yesterday. There is a slim chance for bulls that this might be a bullish wedge underthrow, but the chances are that this rather bearish looking chart is just doing exactly what it appears to be doing and breaking down short term. NDX 60min chart:
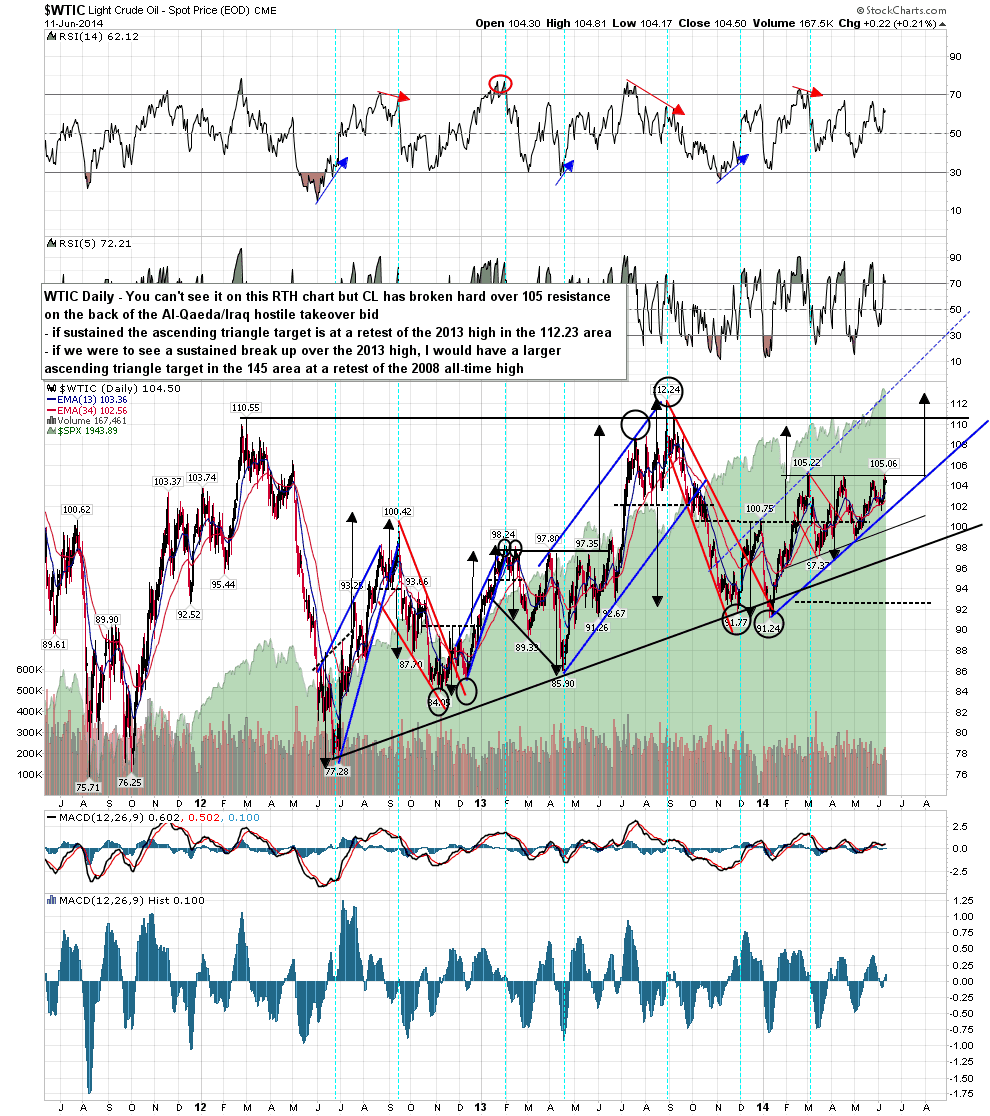
You can’t see it on this RTH chart but oil broke up hard overnight on the Al-Qaeda moves to take over Iraq. If that break is sustained then the ascending triangle target is a retest of the 2013 high in the 112.23 area. WTIC daily chart:
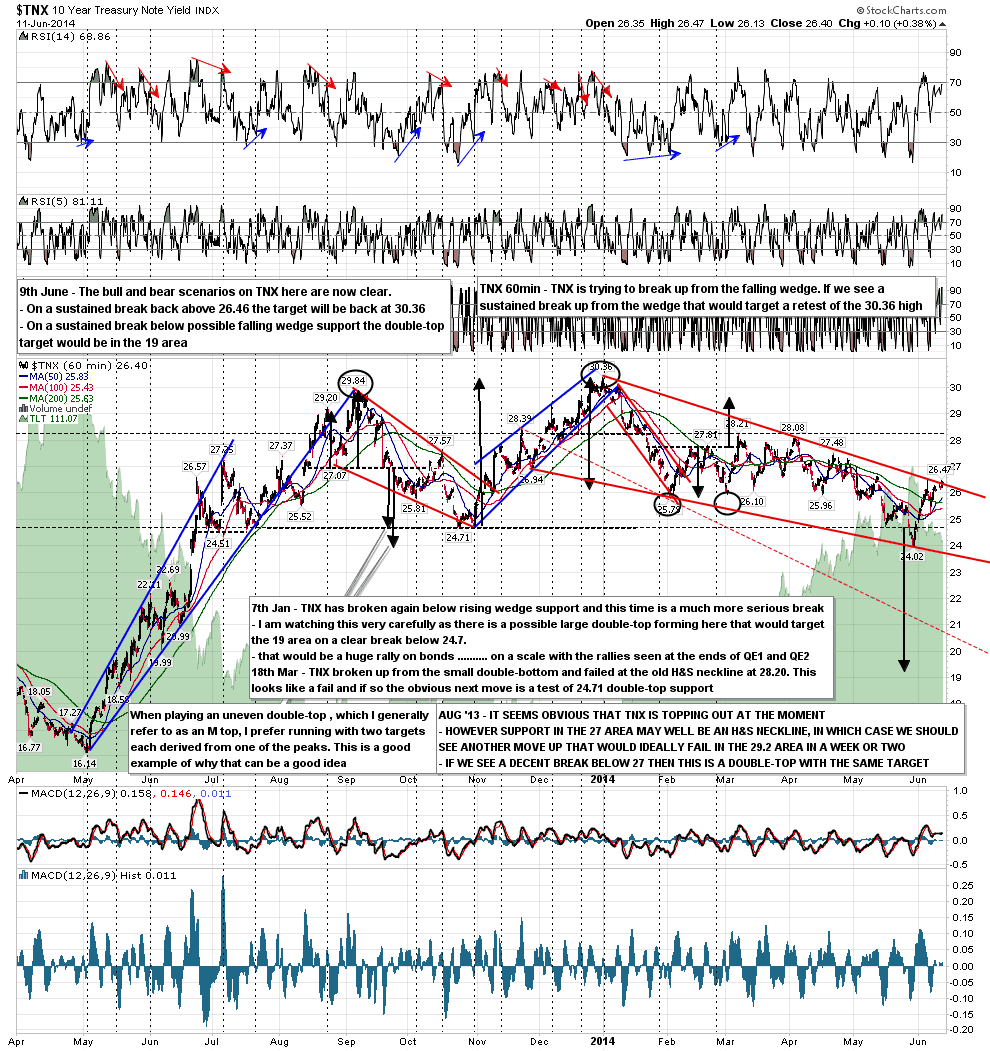
TNX has been trying to break over falling wedge resistance. If we see that break up and the break is sustained then the target would be a test of the 30.36 high. TNX 60min chart:
There has been much talk in recent weeks that a significant decline on SPX would require some kind of news trigger. I am wondering whether this Al-Qaeda attempt to take over Iraq might be that trigger. Certainly the US could not allow that to happen and it’s not hard to see this crisis sliding towards renewed western intervention in Iraq. This could also force the price of oil up hard, which could have a number of interesting consequences.
