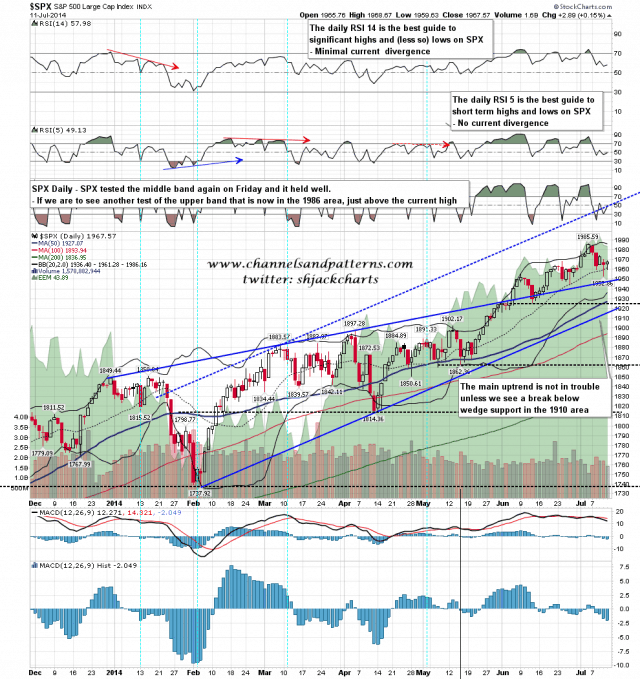
SPX retested the daily middle band on Friday and that held well. Now we get to the interesting part of the candle statistics that I was looking at on Friday morning, albeit with a sample size of only three similar candles over the last twenty three years. After the next day all three then moved to touch the daily upper band on SPY. One of those made a full touch and marginal higher high on SPX, and the other two touched the upper band on SPY but fell short of the touch on SPX while making lower highs. What was the really interesting part though, is that after each tested the daily upper band intraday, all three then fell hard to test the daily lower band on SPY within three days. It will be very interesting to see whether that is repeated here.
On the daily chart SPX retested the middle band and if we see a run at the upper band that is currently at 1986, just over the current all-time high. SPX daily chart:
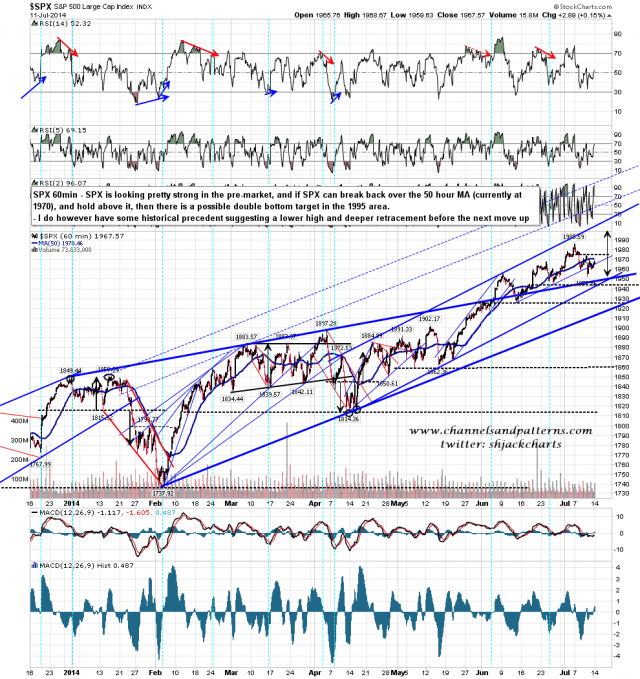
SPX is looking strong in the premarket and it seems likely that it will gap over the 50 hour MA at the open. There is a possible double bottom target in the 1995 area if SPX can break over the current all-time high with some confidence. SPX 60min chart:
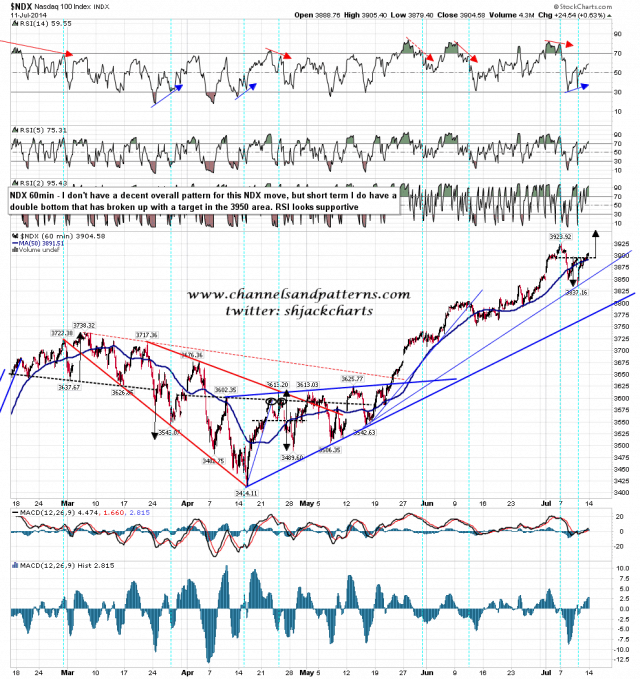
NDX has a similar double bottom setup with much stronger RSI support, and that has already broken up on Friday with a target in the 3950 area. NDX 60min chart:
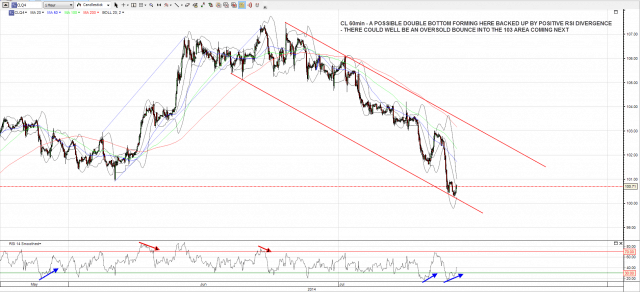
CL and GC are both looking interesting on the long side, with a stronger setup on CL, which has strong positive RSI divergence at possible falling channel support. A small double-bottom may be forming and we could see a strong oversold bounce into the 103 area. CL 60min chart:
I’m leaning bullish on SPX today and looking for a retest of the highs, unless we see a serious fail at the 50 hour MA at the open. If my candle stat holds then there is obvious a serious chance that we see that test made intraday, and that is then followed by a sharp decline over the rest of the week. As I said though, that stat is based on a small sample group, so it may not deliver.


