
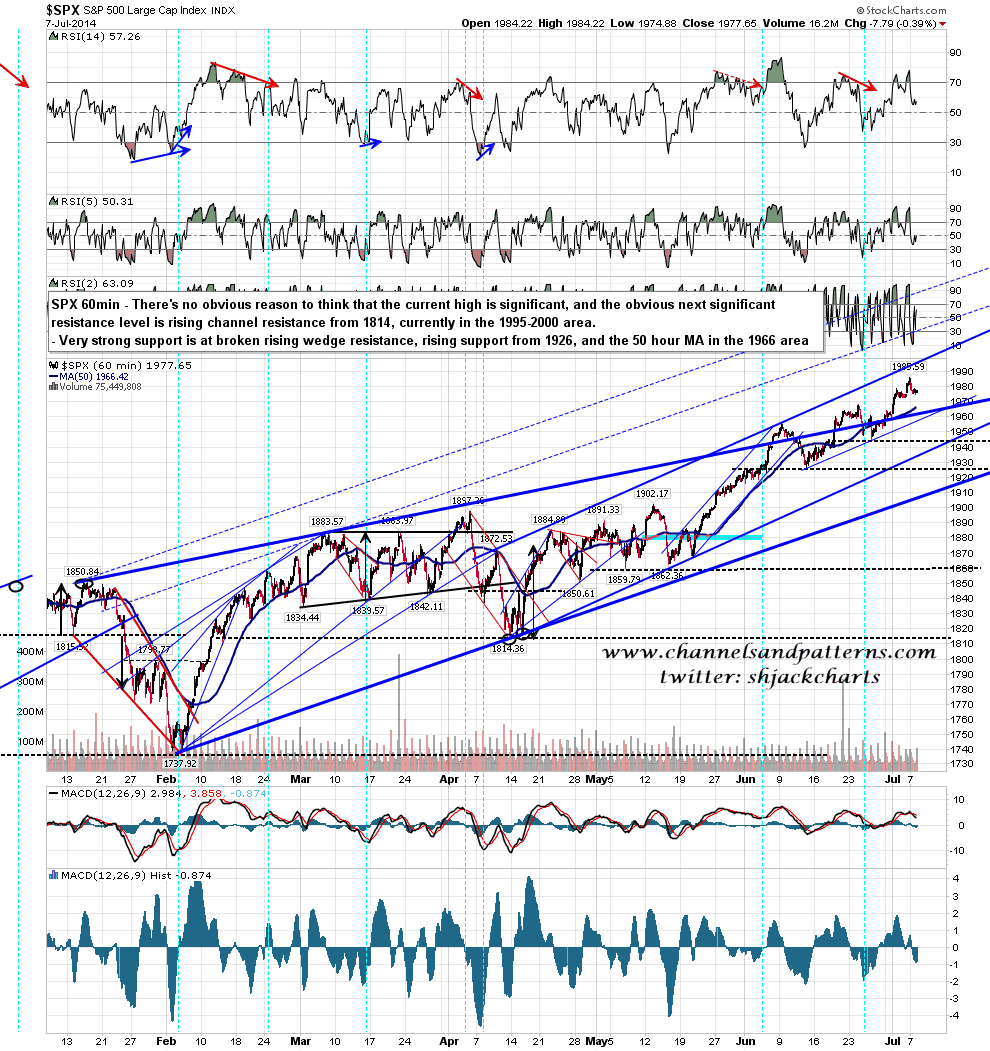
Now that primary channel resistance has been broken. I’ve been considering the upside targets that are now in range as a result of that break. The first one is rising channel resistance from the 1814 low, and I have that currently in the 1995-2000 area. That looks like the obvious next candidate for a short term high area as I can’t see any reason here to think that the current high might hold more than a couple of days.
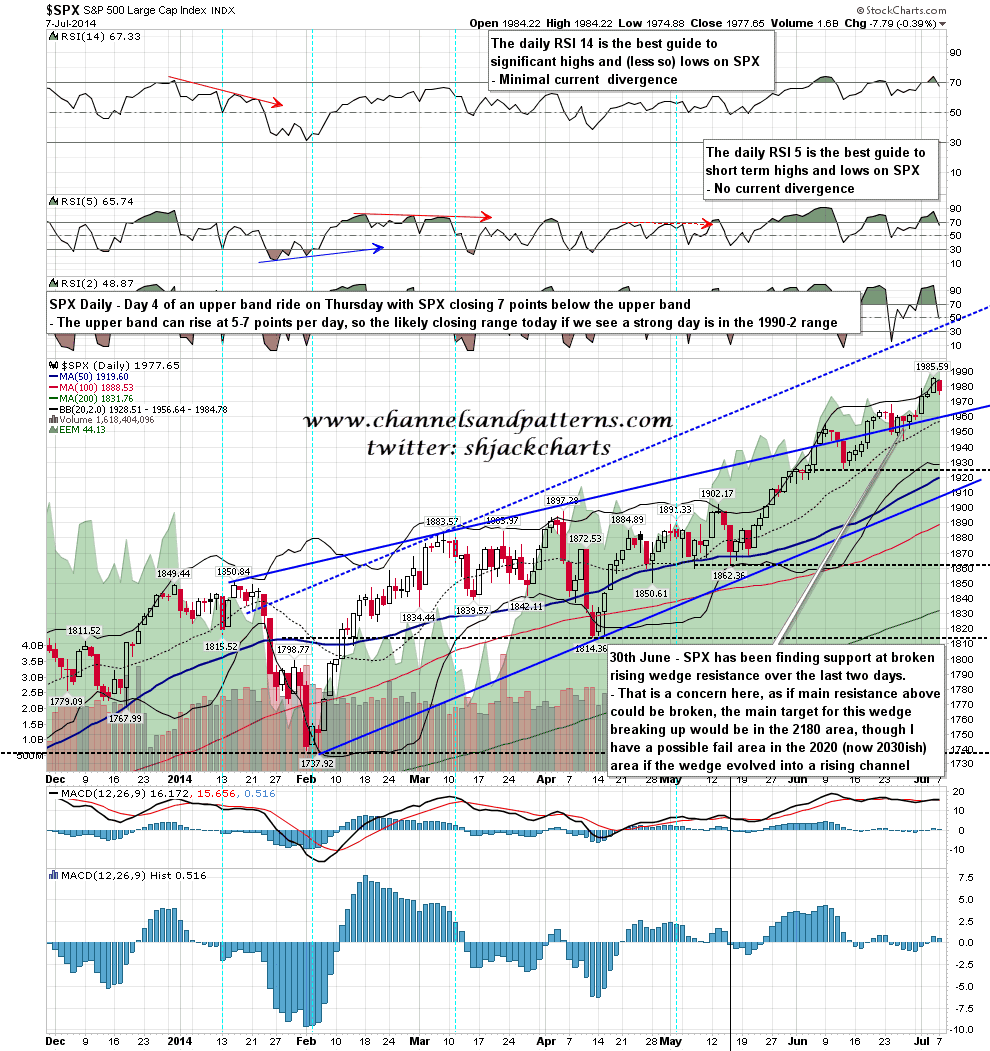
Over the longer term there is obviously the issue that the rising wedge from 1737 appears so far to have broken up, though it’s still just about possible that this action above it could be a wedge overthrow. The break of primary channel resistance suggests otherwise however. There are two obvious targets for this wedge breaking up. The first is the full technical target for the wedge, which is in the 2160 area, and that will be my primary target if my other target is taken out. The other target, as wedges often evolve into channels, is possible rising channel resistance from 1737, currently in the 2030 area, with a possible alternate option currently in the 2050 area. I am therefore assuming that the current overall uptrend should be good to at least 2030, though we might well see a strong retracement into the 1940-60 area from shorter term channel resistance in the 1995-2000 area.
SPX retraced a bit yesterday as expected, and we may see some more retracement today. If so I have very strong support in the 1966 area at the intersection of broken rising wedge resistance, rising support from 1926, and the 50 hour MA. That should be a solid floor, and a break below that would look significantly bearish. SPX 60min chart:
On the daily chart SPX closed seven points below the upper band yesterday. If we see a strong day today the daily upper band could close as high as the 1995-2000 area. SPX daily chart:
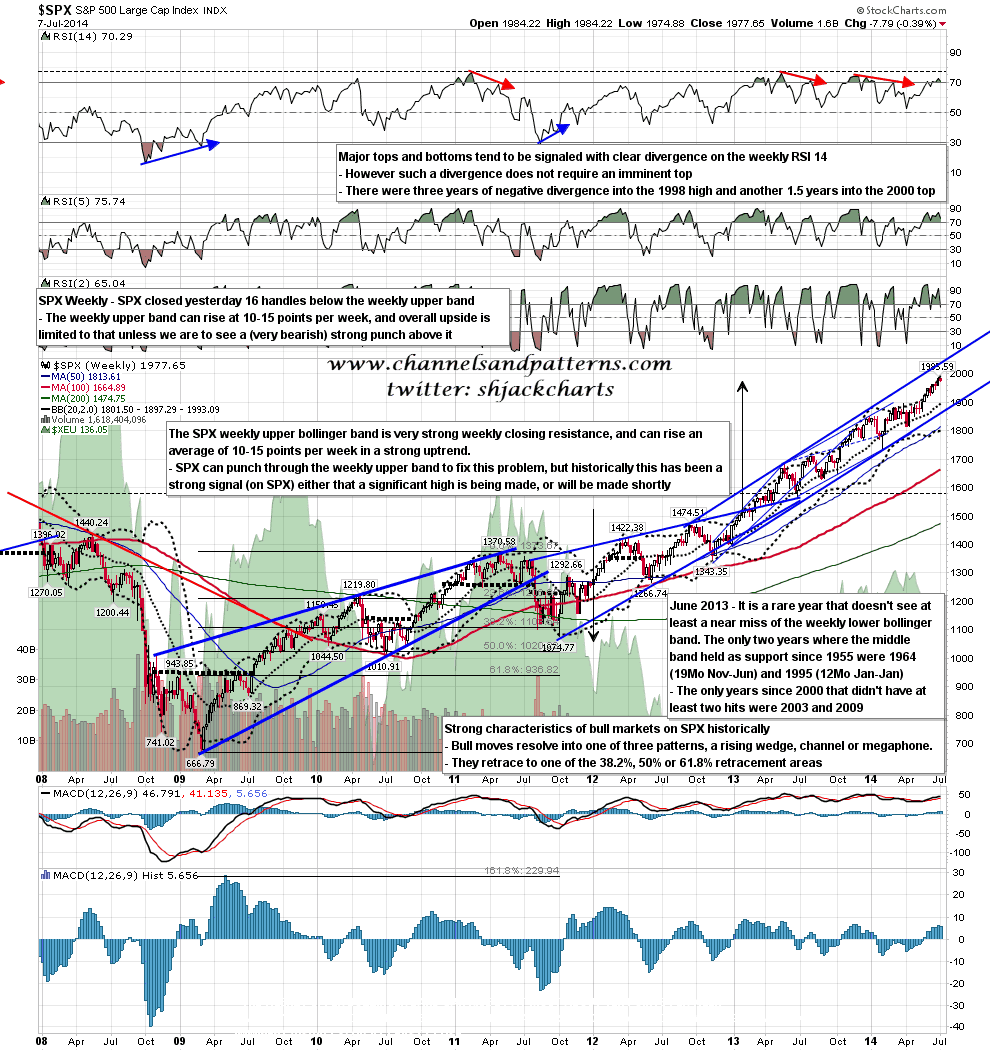
I have the weekly upper band now at 1993, and wouldn’t expect that to close higher than 1996 this week. That puts 2000 in range this week and is a good fit with my resistance trendline in the 1995-2000 area. SPX weekly chart:
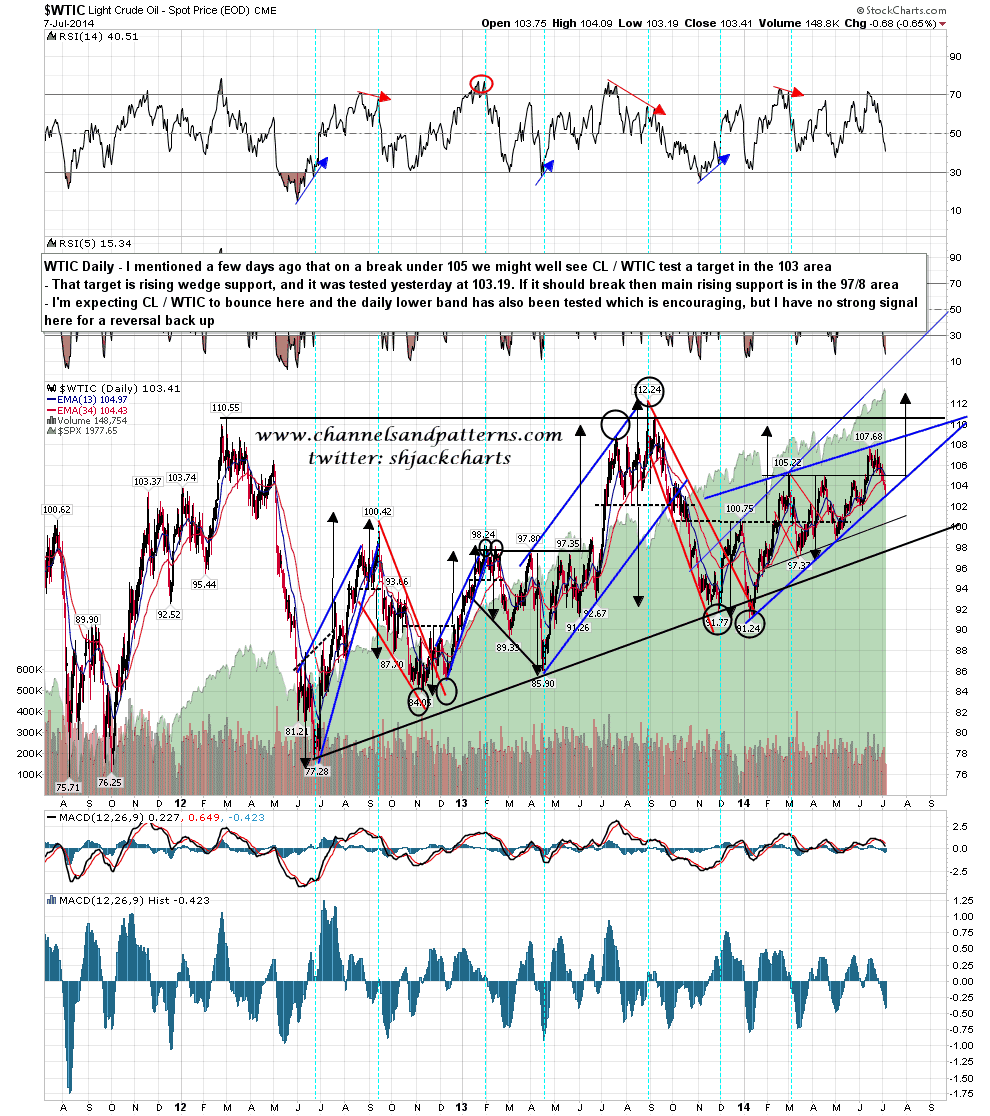
I mentioned a couple of weeks ago that if CL broke below 105 then I’d be looking for a hit of a target in the 103 area. That target was rising (wedge) support from the 91.24 low and that was tested at 103.19 at the low yesterday. The daily lower band on CL was hit at the same time so we may well see CL reverse back up here. If it breaks down from that trendline then the next big support trendline is in the 97/8 area. WTIC daily chart:
We may see some more downside this morning, but unless we see a break below 1966 I’m looking for new highs in the near future. I can’t see any reason to think that the current high won’t be broken soon and am looking for a test of my 1995-2000 target in the next few days. This looks like a dip to buy.
