
That was a very rare daily candle yesterday, not visible on SPX, because for some reason the SPX data feed doesn’t seem to notice gaps much for reasons I have tried and failed to establish in the past, but on SPY, which is what I use when I want a true picture of the daily candle. The candle for the day was a strong gap down through the daily middle band, with a recovery back above it, and I was only able to find three comparable candles going back to 1991.
In those three instances two traded intraday below the middle band the next day and both closed red for the day, with one closing significantly below the middle band. The other example rose modestly the next day. What was interesting though was what happened afterwards, which was that in all three instances SPX then rose to touch the upper band on SPY (a little short in two instances on SPX), and then immediately retraced back to the lower band. That was very interesting though a total sample size of three is very small and yesterday’s gap under the middle band was the deepest of them all so even those three aren’t necessarily fully comparable. .
SPX is making lower highs and lows at the moment and as long as that lasts, bears have the short term edge here. The bounce yesterday was a decent 50% fib retracement of the move down from the high, and yesterday’s high may hold into another move down. I have a decent looking falling channel on the SPX 15min chart, and I’d be looking for a test of that channel resistance in the 1970 area this morning. SPX 15min chart:
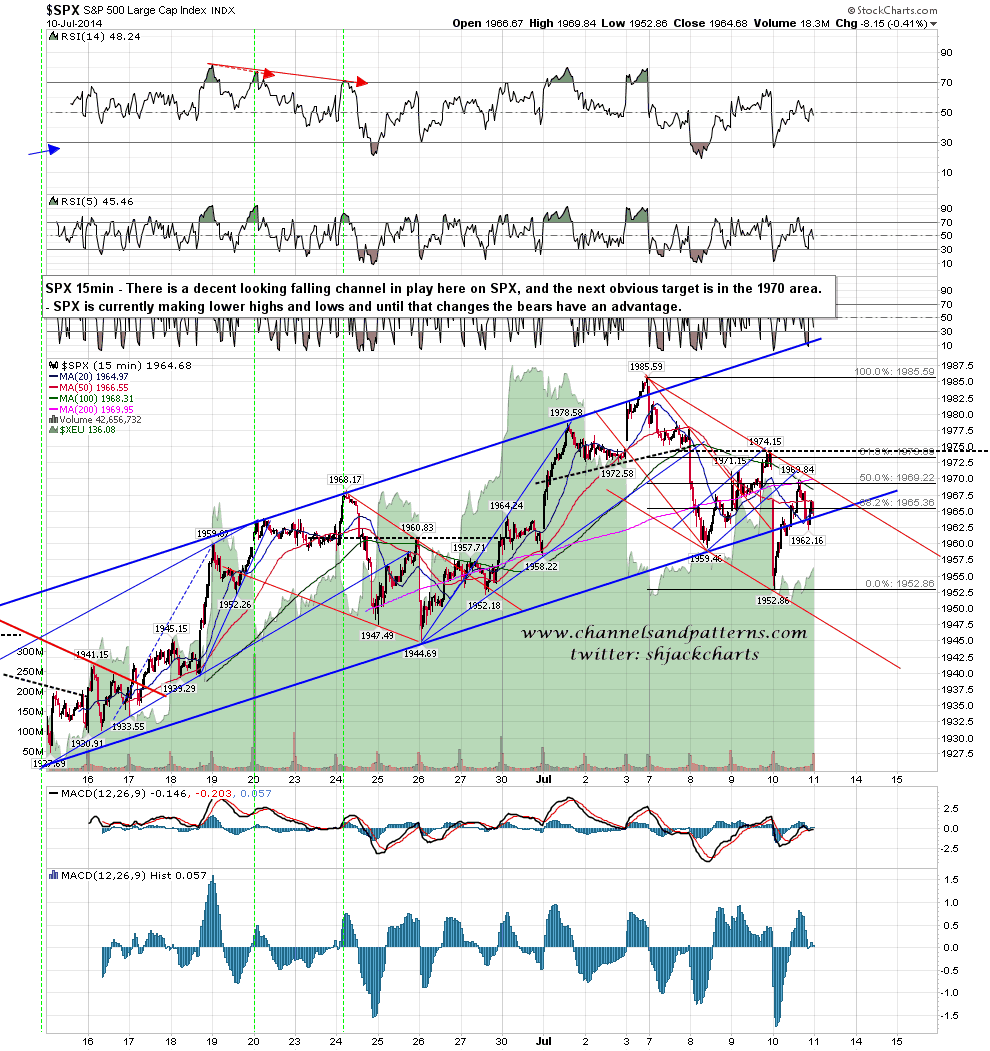
Just above channel resistance is the key bull/bear level for me at the SPX 50 hour MA. That is at 1971 at the moment and if bulls want to turn this back up, then they need to take that back and hold above it, which is what they tried and failed to do on Wednesday. If they can break the last short term high at 1974 with any confidence then the next target should be another test of the daily upper band . SPX 60min chart:
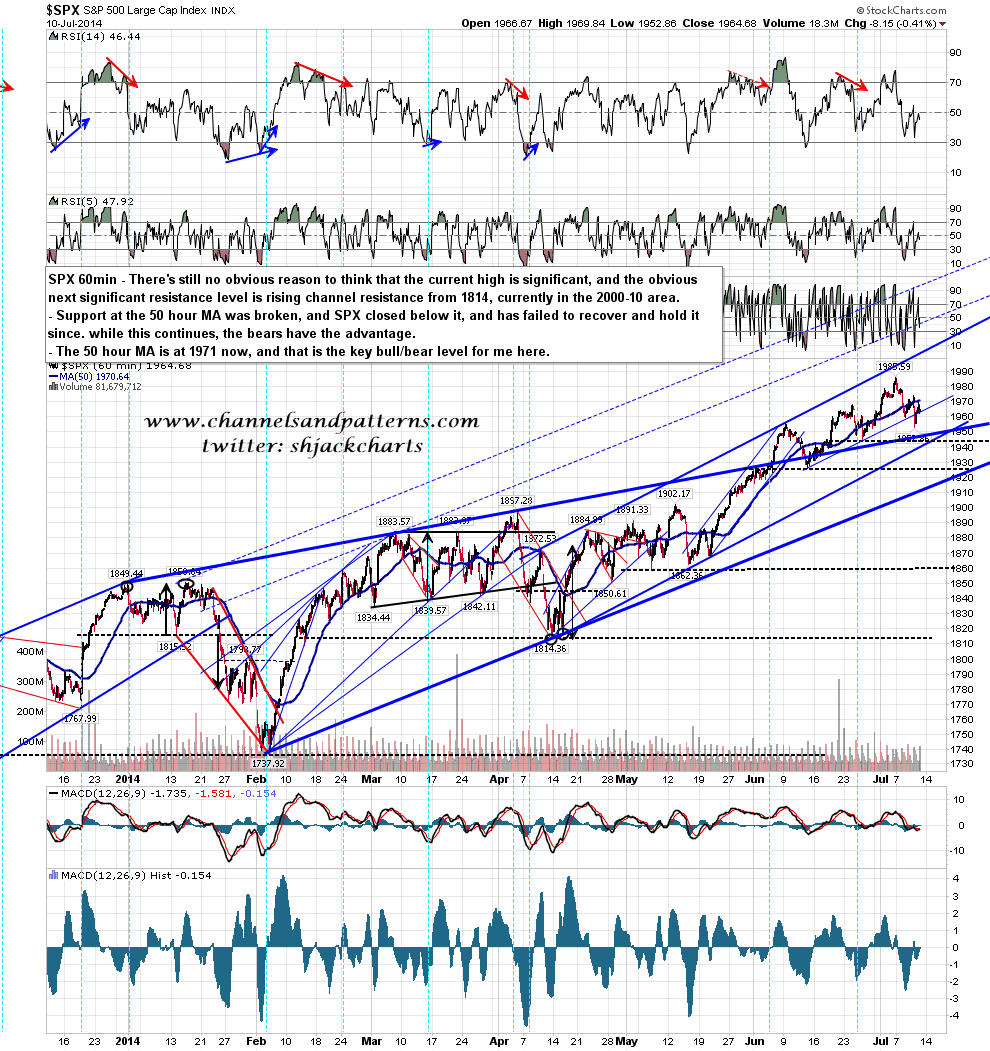
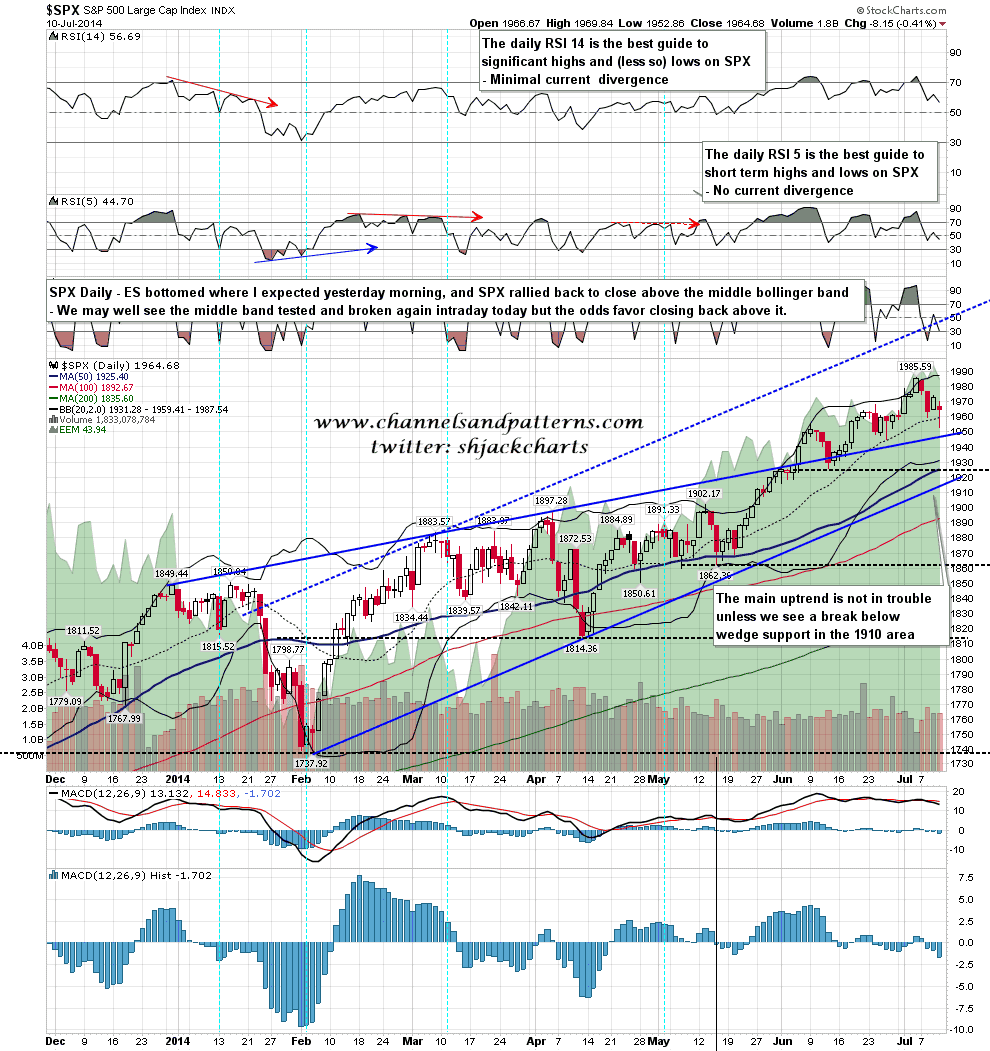
The daily upper band is currently at 1987, and a test and fail there would obviously run a real risk of forming a double top targeting the 1920 area. If yesterday’s candle is showing the way ahead here, then that is what that candle is suggesting. The daily middle band is at 1959 today and history suggests that we may well see that broken intraday today. SPX daily chart:
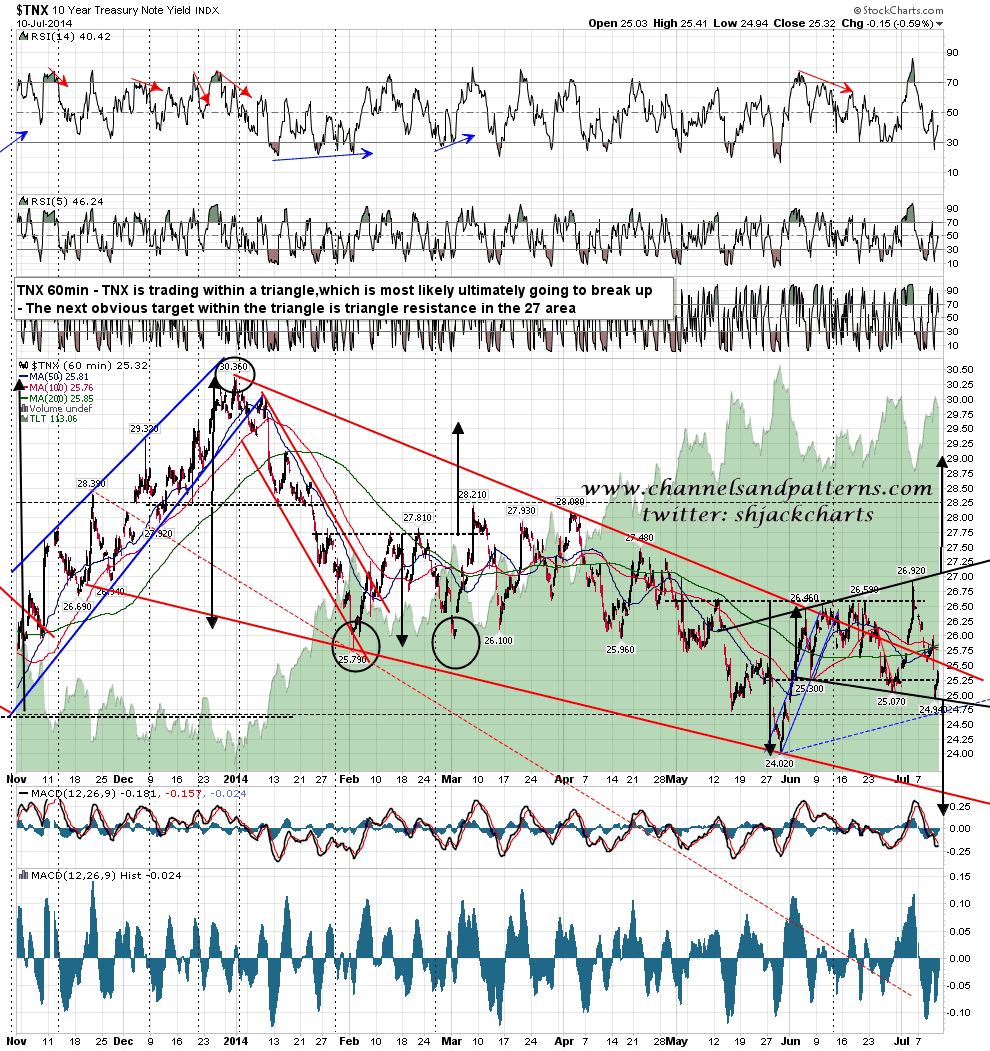
I’ve been wondering what was happening on the TNX chart the last few days and the expansion has resolved into a symmetrical triangle. The larger falling wedge is telling us that this triangle should ultimately break up, and in the short term the obvious next target is the 27 area. TNX 60min chart:
There is strong resistance in the 1970-5 range and bulls may well not be able to break through that today. If that is not broken then I’d be looking for at least a test of yesterday’s low early next week. History suggests that a strong move up is unlikely today and that we may well see a break of the SPX daily middle band at 1959 intraday.
I’ll be posting oil and gold charts later on twitter.
