
All seven of the IHS patterns that I’ve been watching since the lows last week have now made target apart from TRAN and RUT, and of those two, TRAN has come so close that if it failed here, I’d consider it a technical hit. RUT has barely made it out of the gate of course, but I have a theory about that I’ll be coming to later in this post.
I also now have decent trend patterns for this move up on five of those US indices, and passable patterns on the other two, so this move up has now taken form, and a retracement of some kind should be coming shortly.
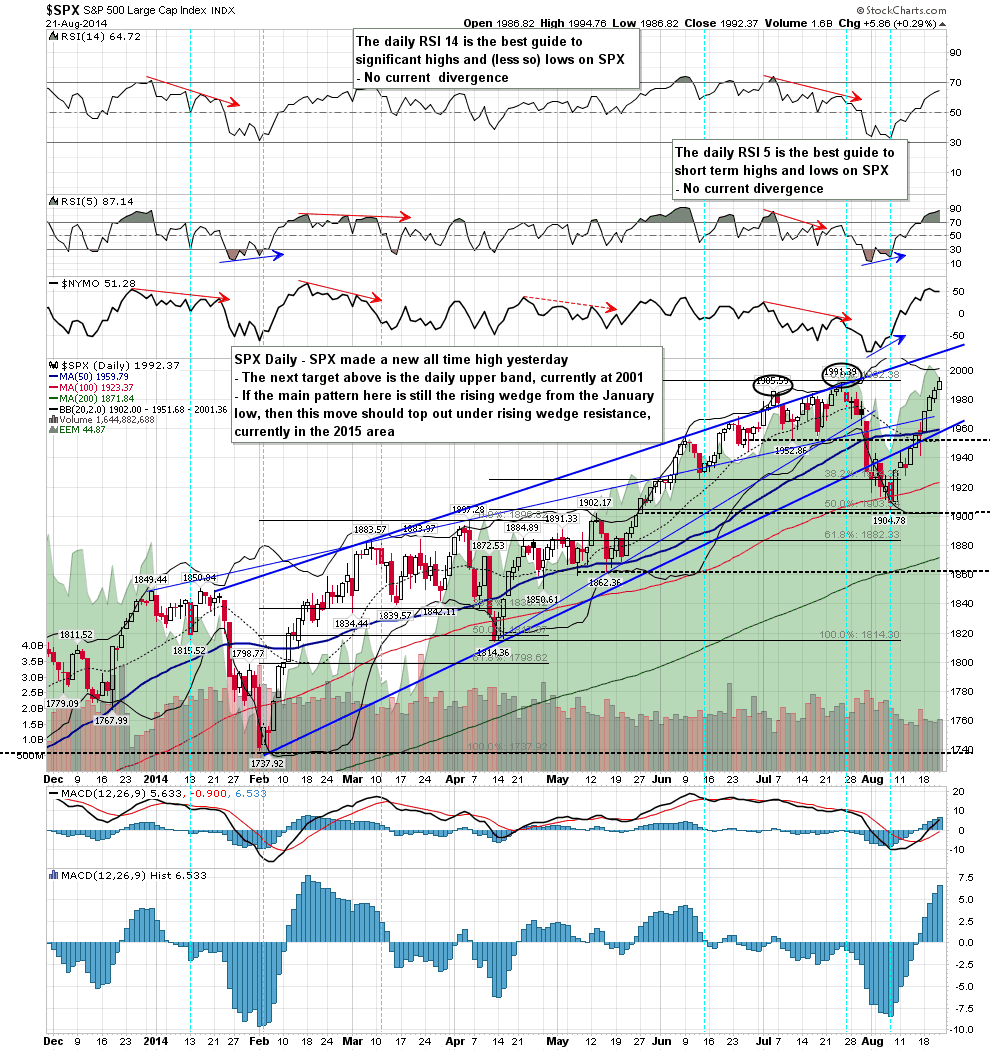
SPX obviously made a new high yesterday, and that new high was not immediately rejected. If we see higher today, which isn’t a given as all seven patterns have already hit their resistance trendlines, then the obvious target is the daily upper band, now at 2001. SPX daily chart:
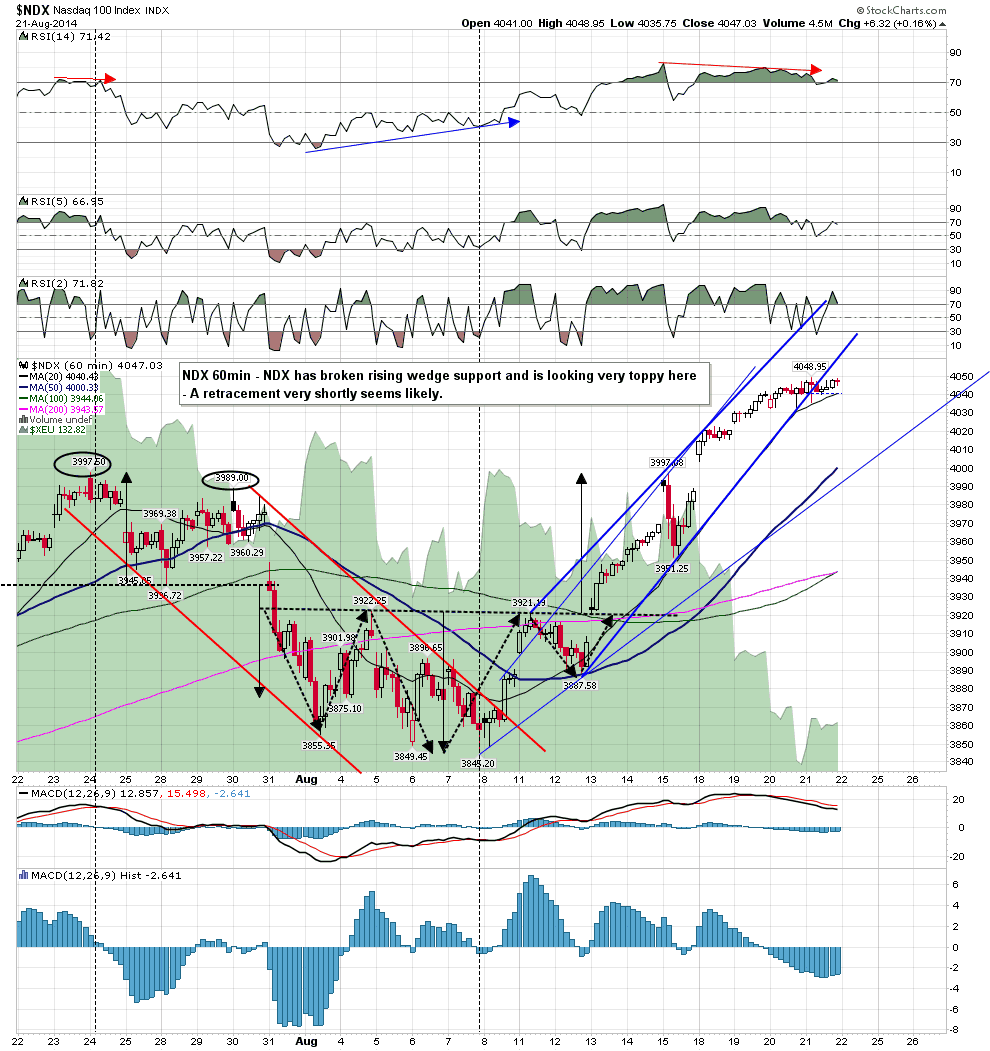
Of the four patterns with decent (three touches) resistance trendlines in play here NDX is the most advanced as it actually broke down from the rising wedge there yesterday. This is the only pattern where the lower trendline is not taken from the actual low, and the obvious retracement target is to the rising support trendline from that low, currently in the 3995 area. NDX 60min chart:
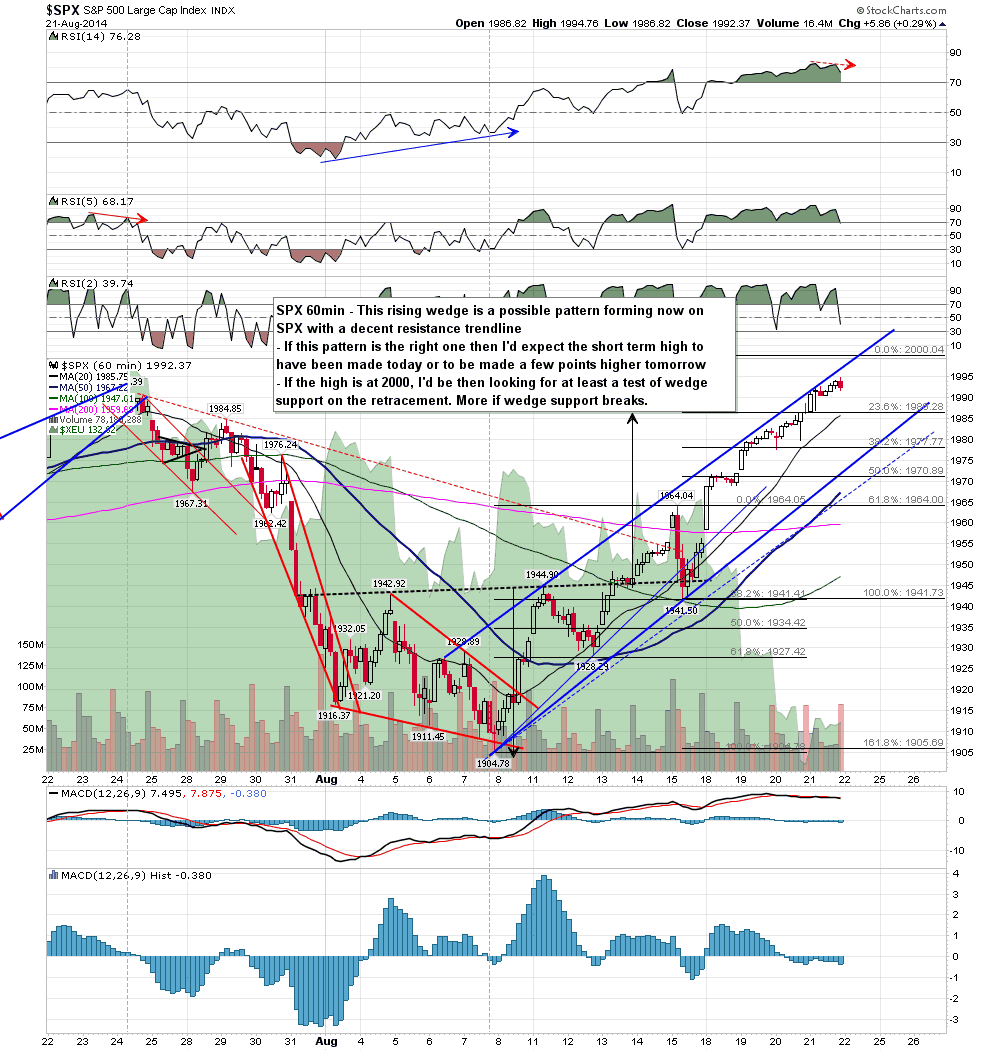
Next is SPX, where there is also a rising wedge from the low with the resistance trendline established yesterday. The obvious retracement target is wedge support, currently in the 1973 area and rising at about six points per day. I mention that last point to underline that a decent retracement to that trendline would be happening today or Monday. SPX 60min chart:
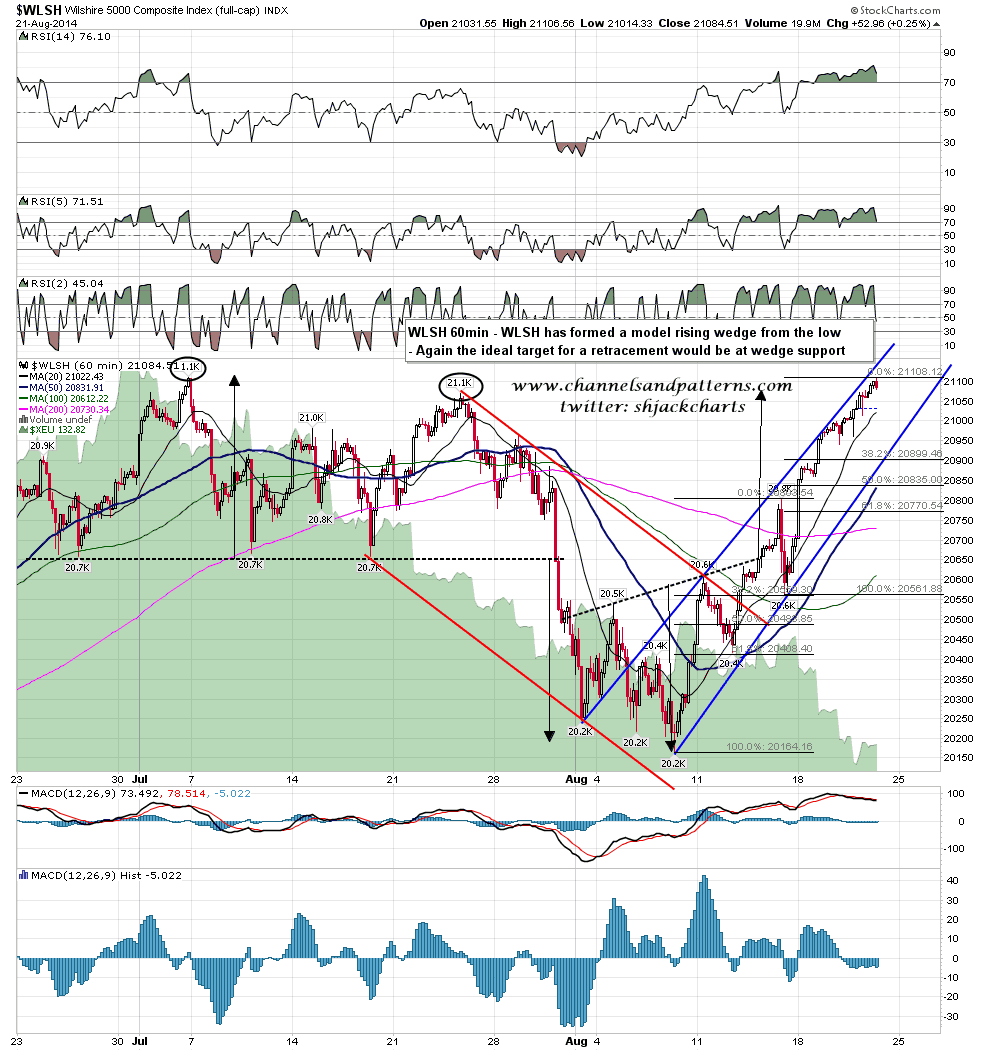
On WLSH, which is the broadest US index, a very nice rising wedge has now formed from the lows. Again the obvious retracement target would be at rising wedge support. WLSH 60min chart:
On Dow the pattern here is a rising megaphone. This and the NDX pattern above are the marker patterns here, as they have furthest to go to their targets. The rising wedges on SPX and WLSH could break and evolve into a channel or a megaphone, but if NDX and/or Dow break down then this retracement may be larger than I am currently expecting. Rising megaphone support on Dow is currently in the 16800 area. Dow 60min chart:

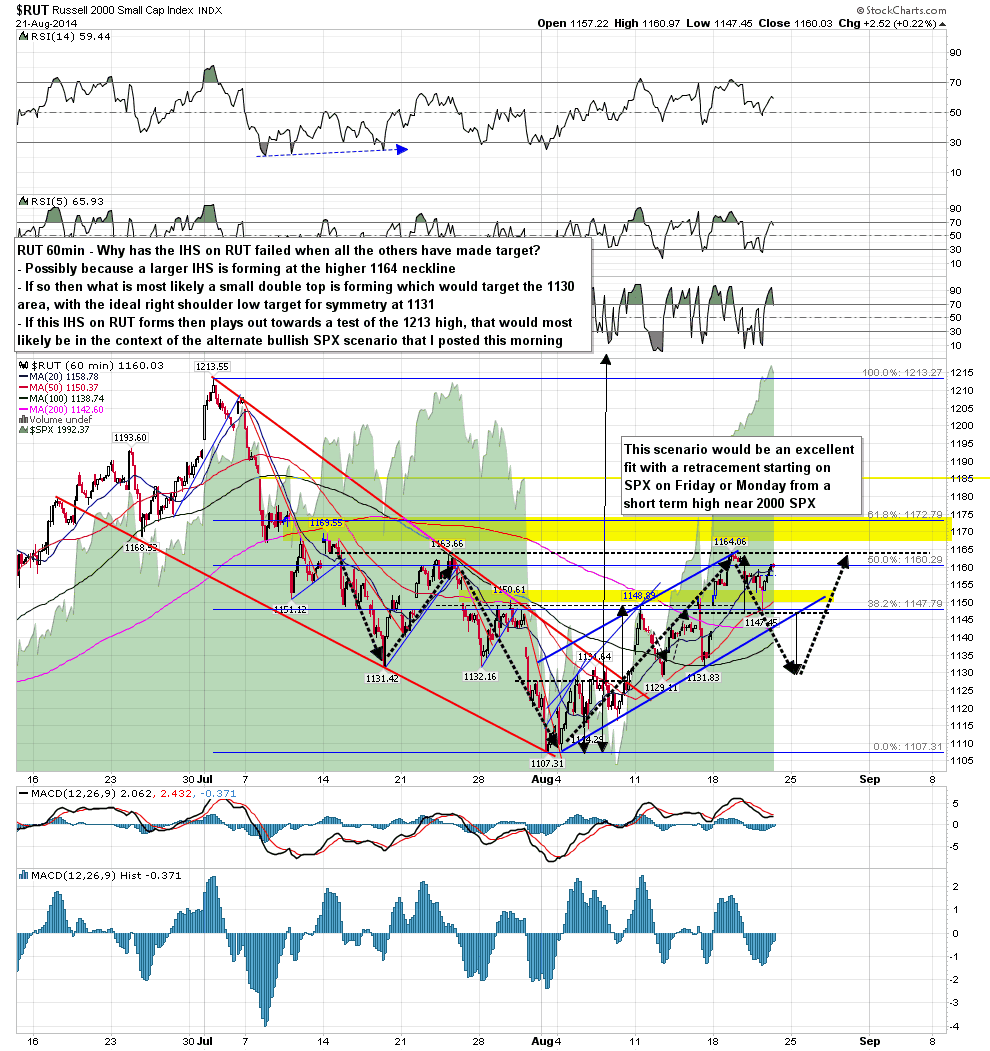
The IHS on RUT stands alone here, as it never really made it out of the starting gate. I have a theory though that RUT may be forming a larger IHS here at the 1164 resistance level and possible IHS neckline. If a retracement on the other indices is imminent, as seems likely, the RUT may well be forming a short term double top with a target in the 1130 area, with the ideal right shoulder low for symmetry in the 1131 area. I’ve drawn up this scenario on the chart below and if this IHS forms and breaks up, the target would be at new highs. That would have very bullish implications for other equity indices so I’ll be keeping a close eye on that. RUT 60min chart:
The last things to talk about today are the Jackson Hole speech at 10am and Draghi at 2.30pm. These may be significant market movers and I am concerned that the retracement I’ve been watching for all week may start, and possibly end, with one of those speeches if the reaction is violent. I’ll be keeping these patterns on my screens all day to watch progress. What I would like, if Lady Fortuna is taking requests today, would be for a touch of the upper band at 2001 today and rejection there into a retracement that lasts into Monday. We’ll see how that goes.
