
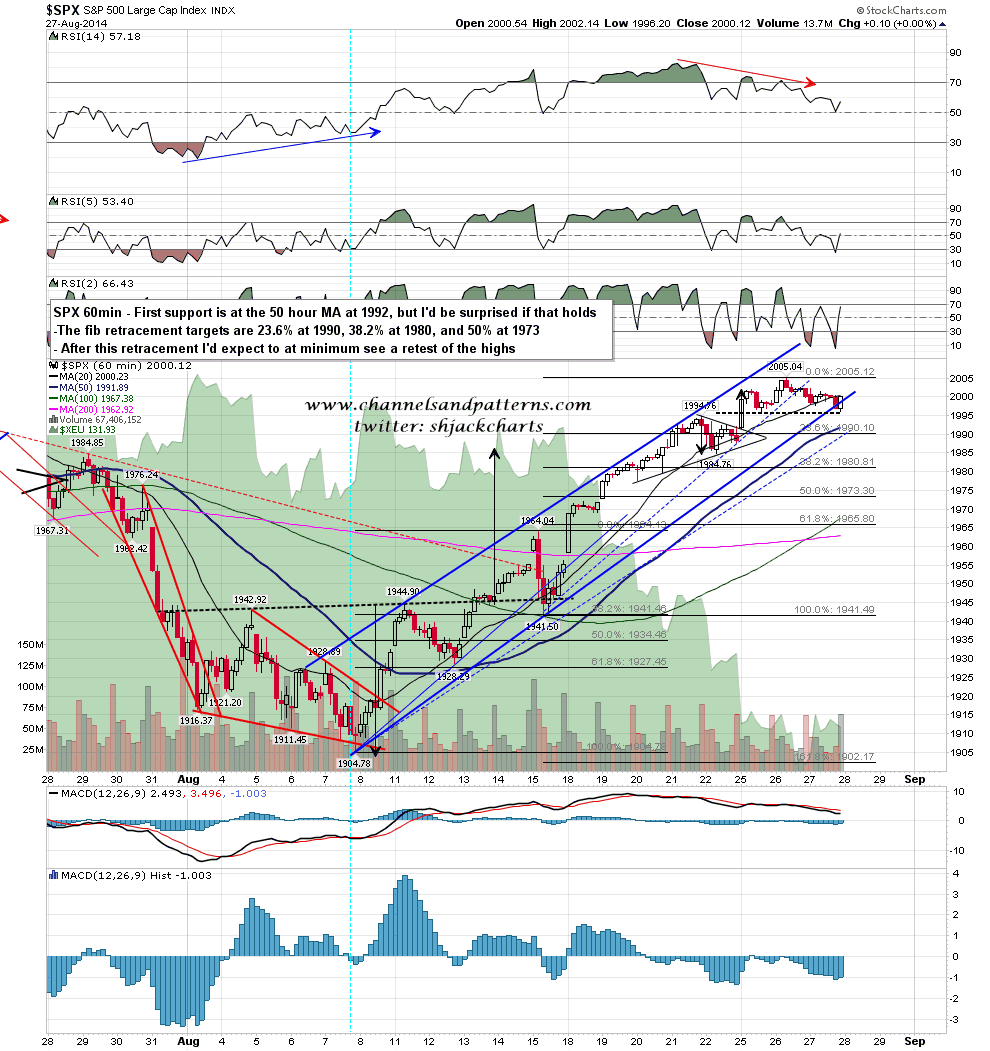
SPX traded sideways yesterday in what looked quite a lot like a bull flag, but has broken down overnight. It seems very likely that an overdue retracement has started, though we might still retest the current high to form a small double top. The main fib retracement targets are the 23.6% fib retrace at 1990, the 38.2% fib retrace at 1980, and the 50% retrace at 1973. The 50 hour MA is at 1992 and might hold for the 23.6% option. Rising wedge support has already broken, so that is no longer support. SPX 60min chart:
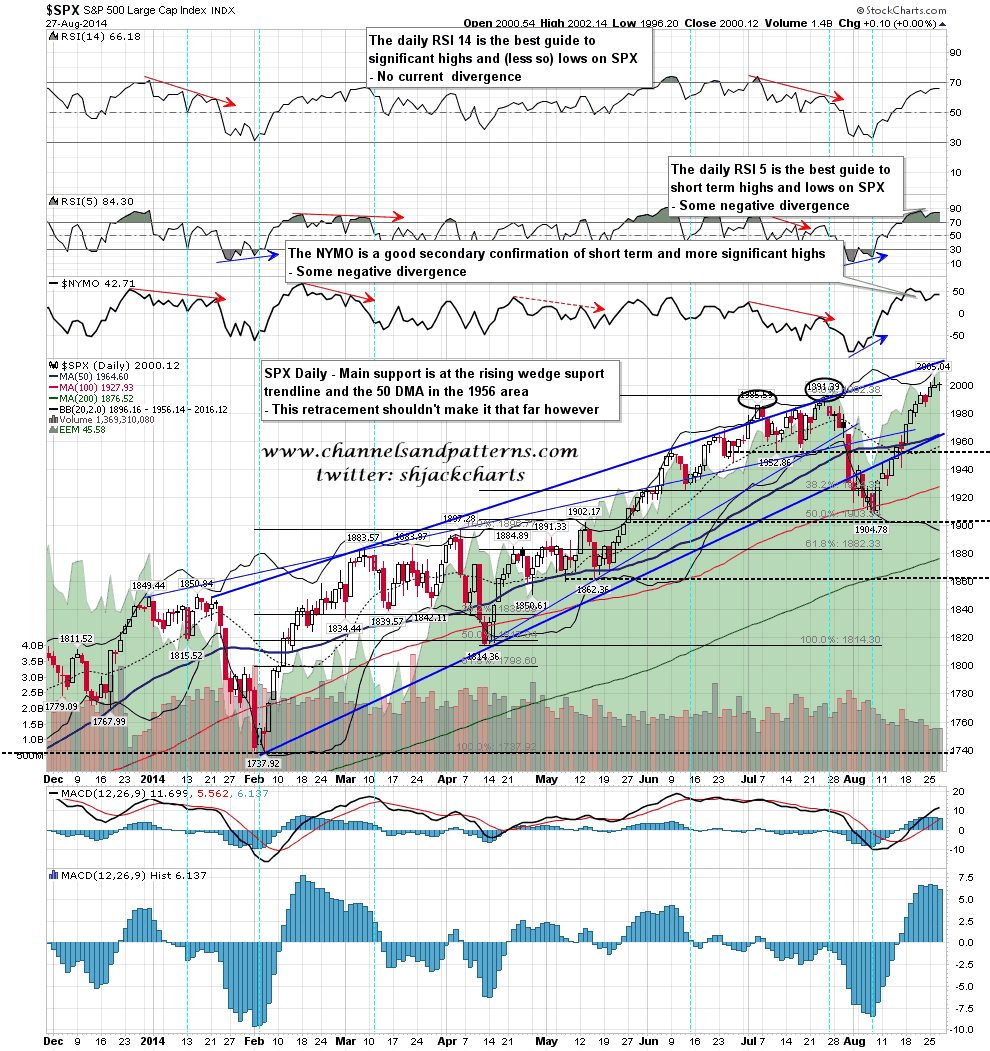
I’m leaning towards either of the 1980 or 1973 targets ideally, as this would (on my primary scenario) be setting up a topping pattern for a last new high. I have main support at 1956 at rising wedge support from the January low and the 50 DMA, but if SPX gets that far then a stronger high than I was expecting would already most likely be in. SPX daily chart:
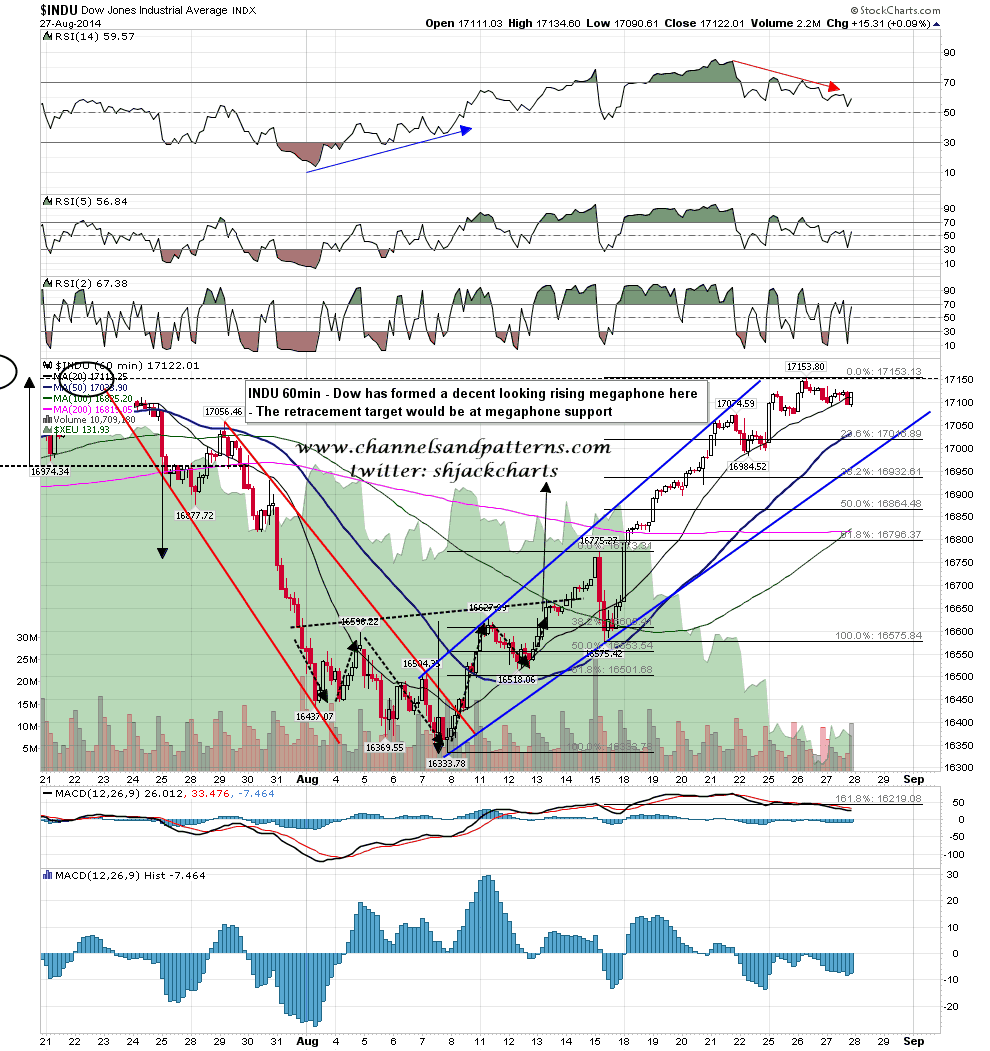
I’m watching the Dow, NYA and RUT charts for hits of the support trendlines on those charts from the last low. Dow is a decent example of the distance yet to be covered from the close yesterday. The best fit on SPX would most likely be the 1980 target. Dow 60min chart:
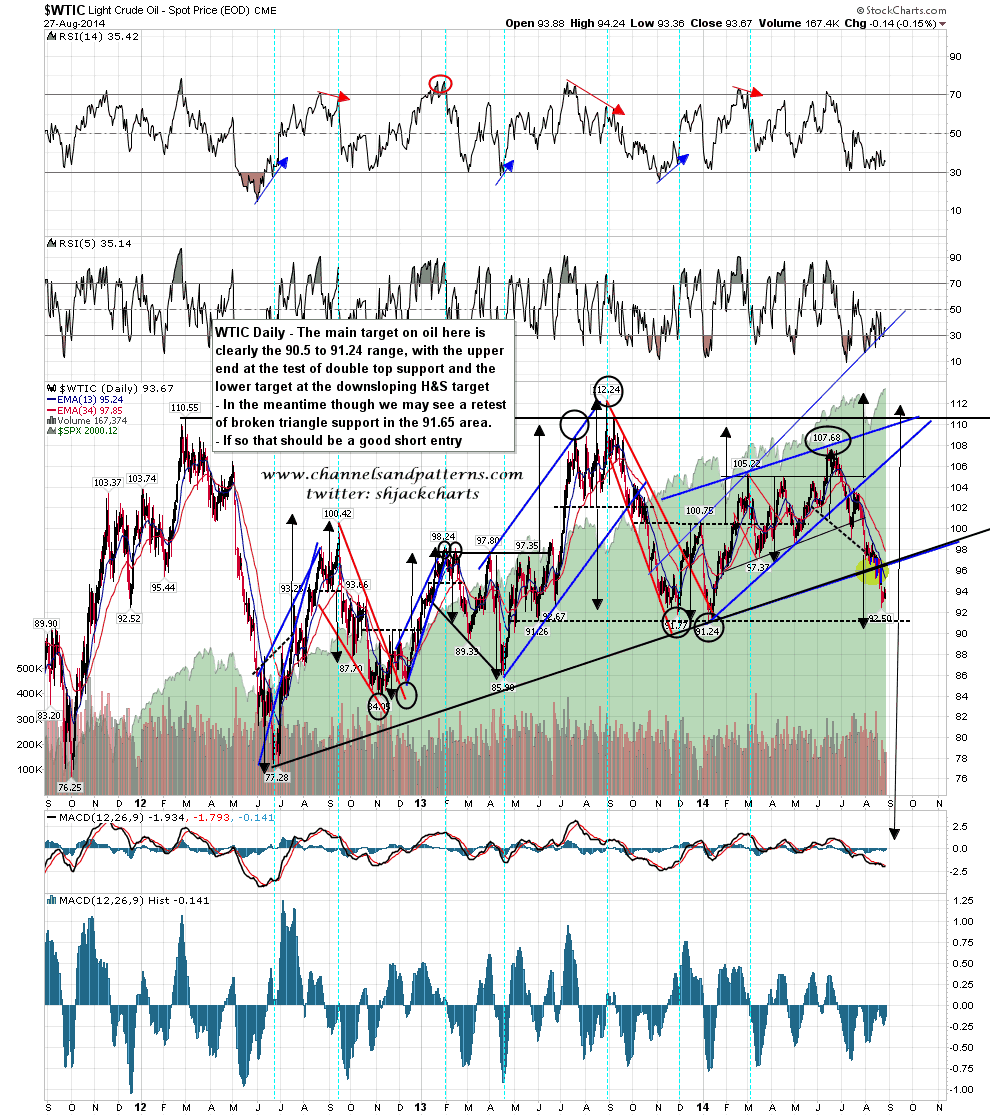
Oil has been rallying a bit and I think we may see a retest of broken triangle support in the 96.5 entry. I don’t think that a significant low is in so if we see that retest, that should be a short entry. WTIC daily chart:
I’ll be looking for the retracement pattern today and will post it on twitter when I have identified it. I’m looking at this as a retracement to buy before another (probably last) push up into a significant high.
