
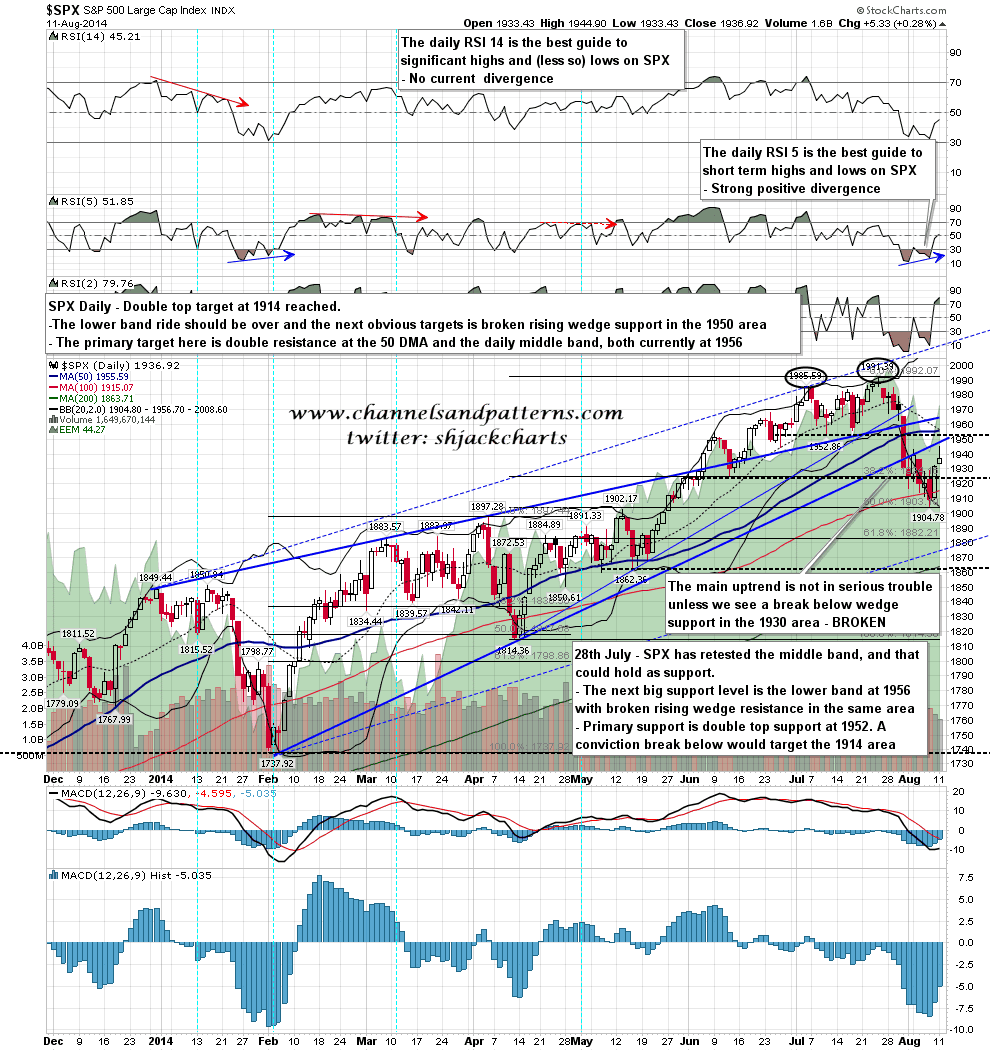
The first thing to say today is that even on the bear rally scenario, the chances that the rally high was made yesterday are small. That’s because of the seventeen similar buy signals from the start of 2007, only two failed to reach the 70 level on the RSI 5, and both of those failed just over 60. The RSI 5 closed at 51.85 area yesterday and I am therefore assuming that SPX will test main resistance at the 50 DMA and the daily middle band sometime in the next three days. Those are both currently at 1956. SPX daily vs NYMO and RSI 5:

There is a slightly lower target as well at broken rising wedge support in the 1950 area, but I’d expect SPX to go through that to test the 50 DMA and daily middle band. SPX daily chart:
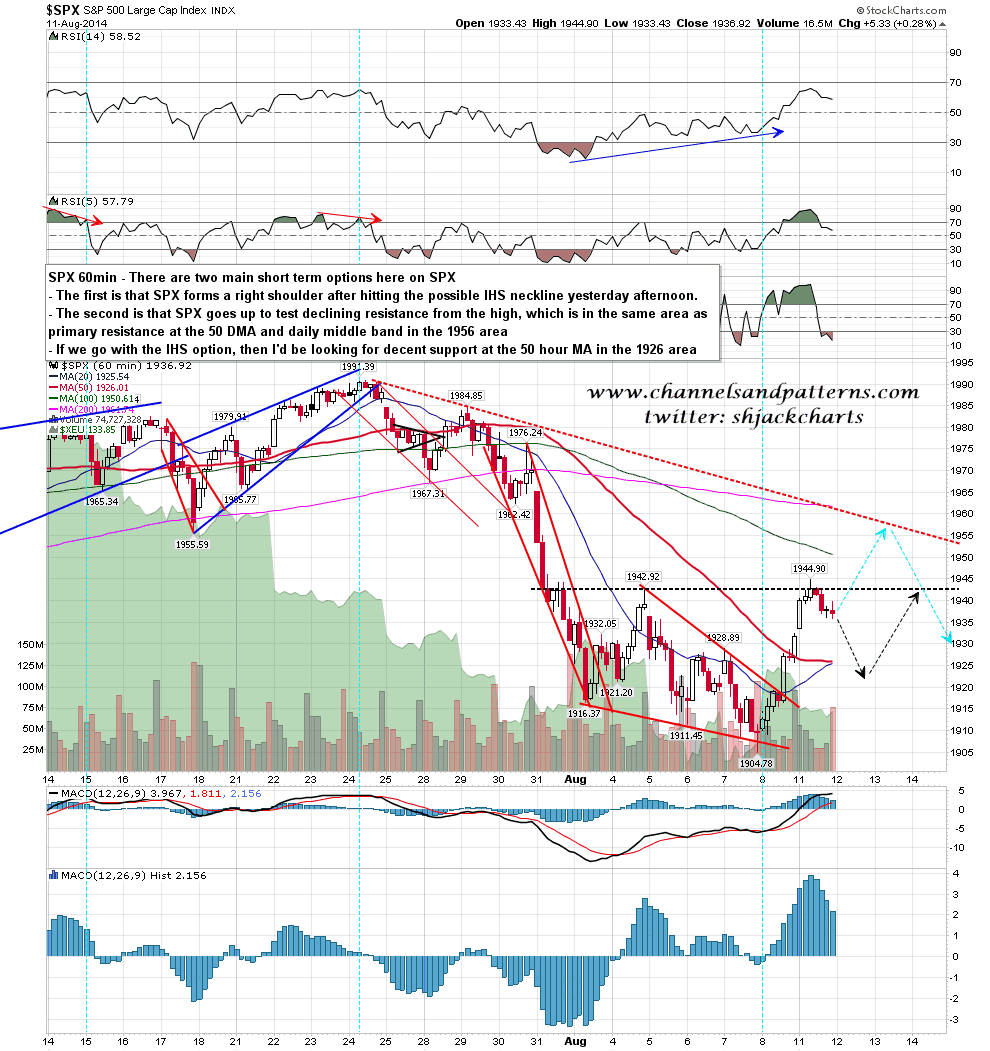
So how does SPX get there? Well the first option is that yesterday’s high was a reversal at the obvious IHS neckline. If we are running that scenario then SPX should retrace for much of the day and then break up. This is the more bullish option as the target would be in the 1985 area, well above resistance in the 1956 area. The second option is that SPX moves directly to test key resistance in the 1956 area, with added resistance there at the moment from rising resistance from the high in the same area. This option gives the bears a better setup for failure there, though in any case we might well see a retracement from that area, and a failure of this buy signal there unless the RSI 5 makes target at 70 is a relative long shot historically. SPX 60min chart:
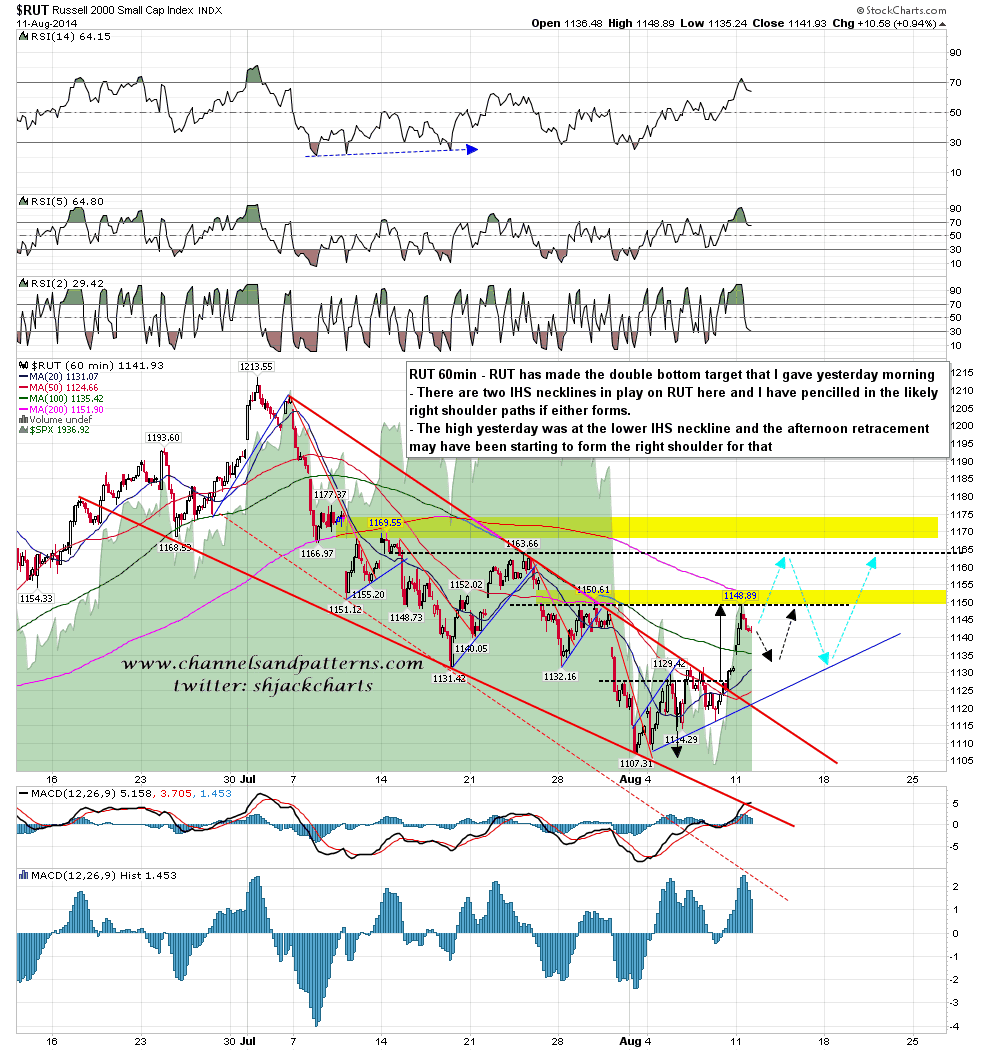
The levels on RUT match well, though in both cases on RUT the resistance levels are possible IHS necklines. I have sketched out possible paths for both options on the chart. RUT 60min chart:
ES has been weak overnight and has made a short term lower high and low. At the moment that is favoring the case for a fairly weak day today to form the right shoulders on those IHS patterns. Bigger picture I am leaning bullish here and expecting a retest of the late July high, though most likely that would be setting up a larger decline after that.
