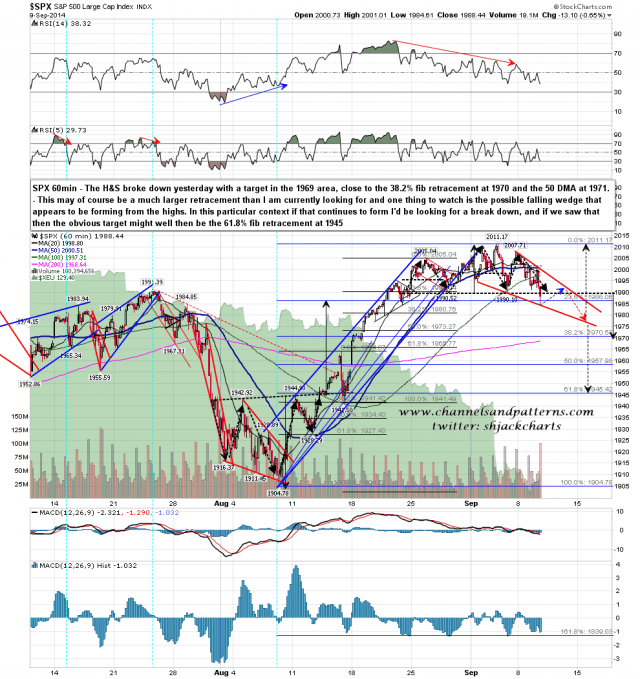
SPX broke down and closed under H&S support yesterday, and that H&S has a target at 1969, close to 38.2% fib retrace target at 1970, and the 50 DMA at 1971. There is obvious significant support at that target. The low yesterday was a test of the daily middle band, and that is holding so far.
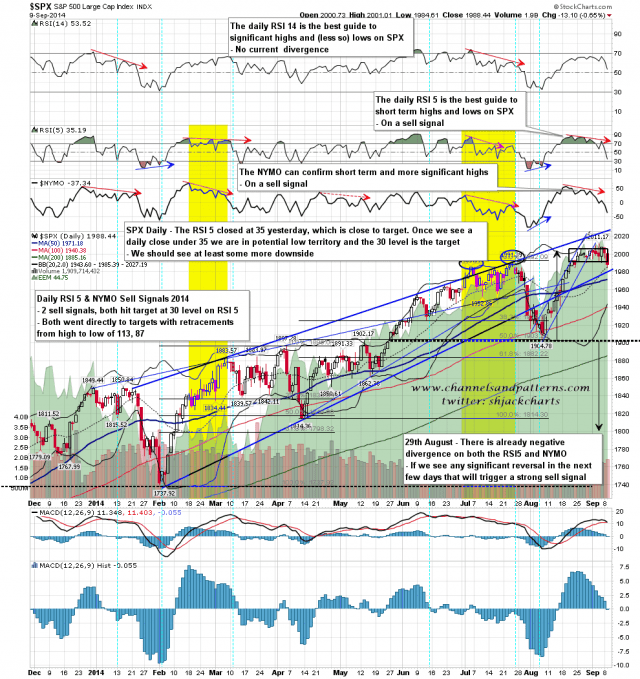
I was disappointed to see the daily RSI 5 close at 35.19. The possible low range starts under 35.0, so that does mean we have at least one more weak daily close within this signal, but once we see a close under 35 then there is a one in four chance of making a low between 30 and 35, and when the RSI 5 hits 30 on a daily close then the signal has made target. SPX daily chart:
On the 60min chart I may have a falling wedge developing and if so, we might well see a rally from yesterday’s low into falling wedge resistance in the 1984-7 area. I’ve sketched in a possible path for that wedge and if it forms then I’d be looking for that to evolve into a falling channel or break down. That might give us a path to primary support at 1944 so I’ll be watching that with interest. SPX 60min chart:
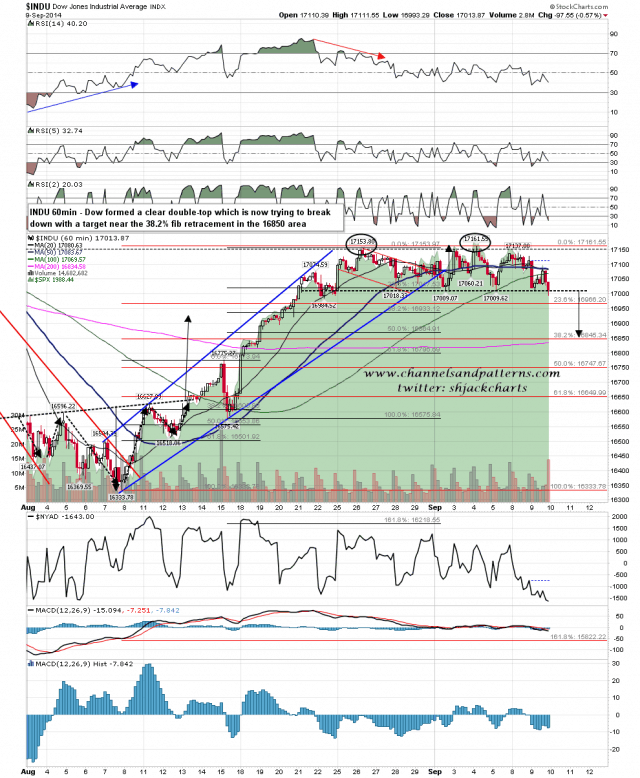
SPX is just part of the story here though. On Dow the low yesterday tested double top support, breaking it slightly before closing back on it. That could fail here, but if it breaks down and holds, the target is in the 16850 area near the 38.2% fib retracement. Dow 60min chart:
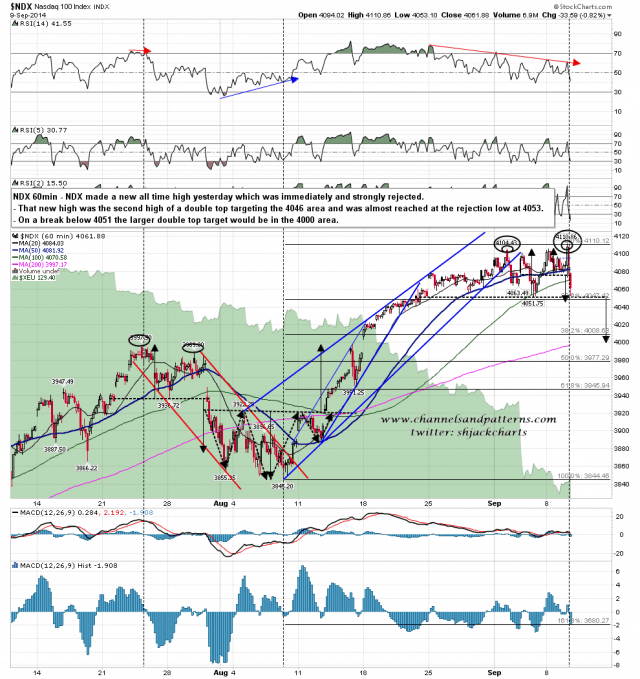
NDX is in a similar position to Dow here, though the AAPL swings yesterday made the second high of a smaller double top which then almost made target at the subsequent low. On a break below 4051 the larger double top target would be in the 4000 area. NDX 60min chart:
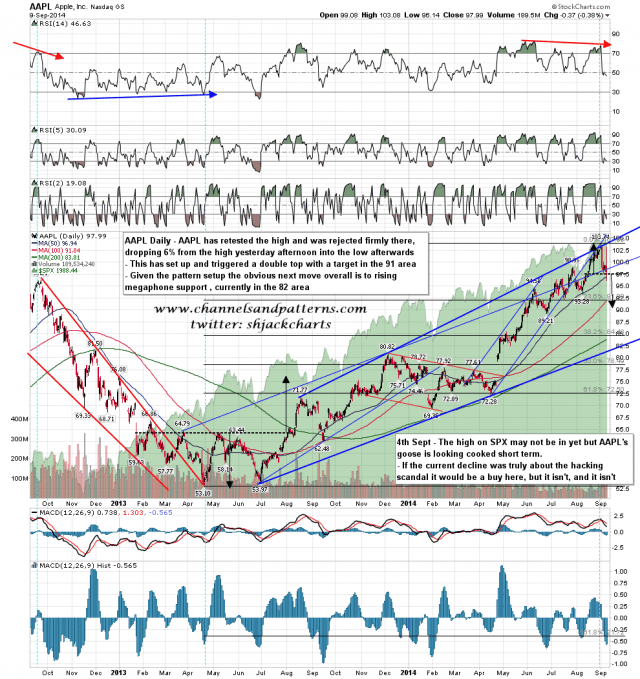
AAPL was shaking everything up yesterday afternoon, so how’s that looking? Well I posted the AAPL chart on September 4th with the comment that there was little to encourage the bulls on the chart. There is even less to cheer them today, as the spike up yesterday has made the second high of a double top that would target the 91 area on a clear break below 97.5. As I mentioned on Sept 4th, this may be the start of a move to test main rising megaphone support, currently in the 82 area. AAPL daily chart:
The still open SPX RSI 5 / NYMO sell signal says that we need at least one more weaker close (on the daily RSI 5). That’s disappointing as I had expected that this signal would have a longer life, but that should still be enough to do significant further damage and if Dow and NDX break down with SPX, then the SPX H&S target is at 1969, and we might see as low as the 50% fib retracement at 1958. Main resistance is now at the hourly 50 MA, currently at 2000.51, and you’ll note that the spike on SPX yesterday afternoon failed there. That shouldn’t now be broken until the main part of this decline has ended.


