
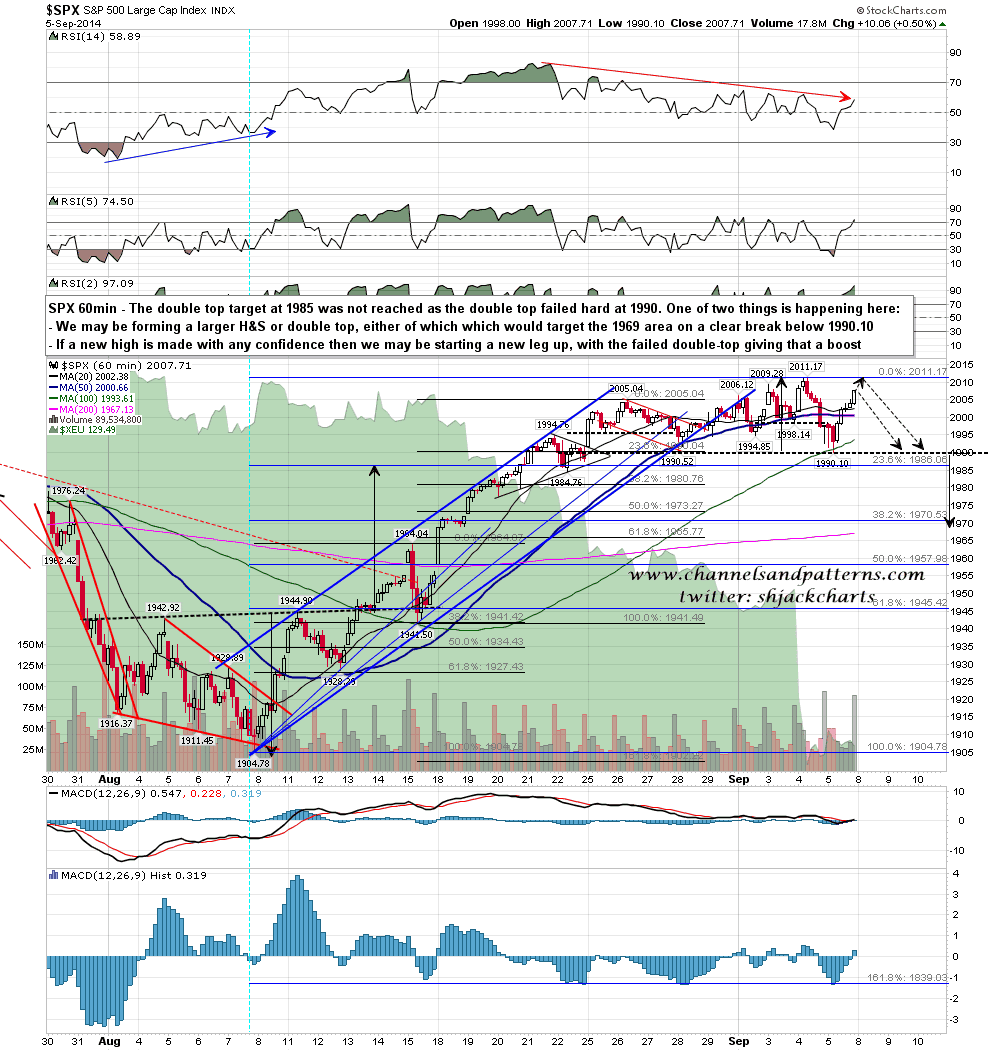
I called the intraday turns on Friday very well, but was struggling to believe what I was seeing. The double top target at 1985 wasn’t made, with a failure at 1990 and a push up to close back at 2007. If we are to make a new high now from that low then that would be unprecedented among the eleven RSI 5 / NYMO daily sell signals going back to the start of 2012.
Looking back further however then there is one precedent for that among the twenty four signals going back to the start of 2007, and it’s not encouraging. That signal didn’t fail, by which I mean it didn’t go as high as the highest RSI 5 peak generating the sell signal, but SPX ran up almost another 4% before making the 2010 spring high. In this case the previous RSI 5 high is lower, but if that held again here SPX might still make it to the daily and weekly upper bands, both currently in the 2030 area, and possibly a bit higher.
If this signal failed, and two of those twenty four signals back to the start of 2007 did fail (March and May 2009 failed though both after reaching the 50 level on RSI 5), then it would be hard to say where the move might top out. In that event I’d be looking for another signal to form as and when. SPX daily chart:

In the short term the setup looks binary. If we don’t make a new high then an H&S or double-top is forming with a target in the 1969 area on a break below 1990. If we make a new high and it isn’t quickly and strongly rejected, then I’d be looking for a move to the 2030 area, with both the daily and weekly upper bands currently in that area. SPX 60min chart:
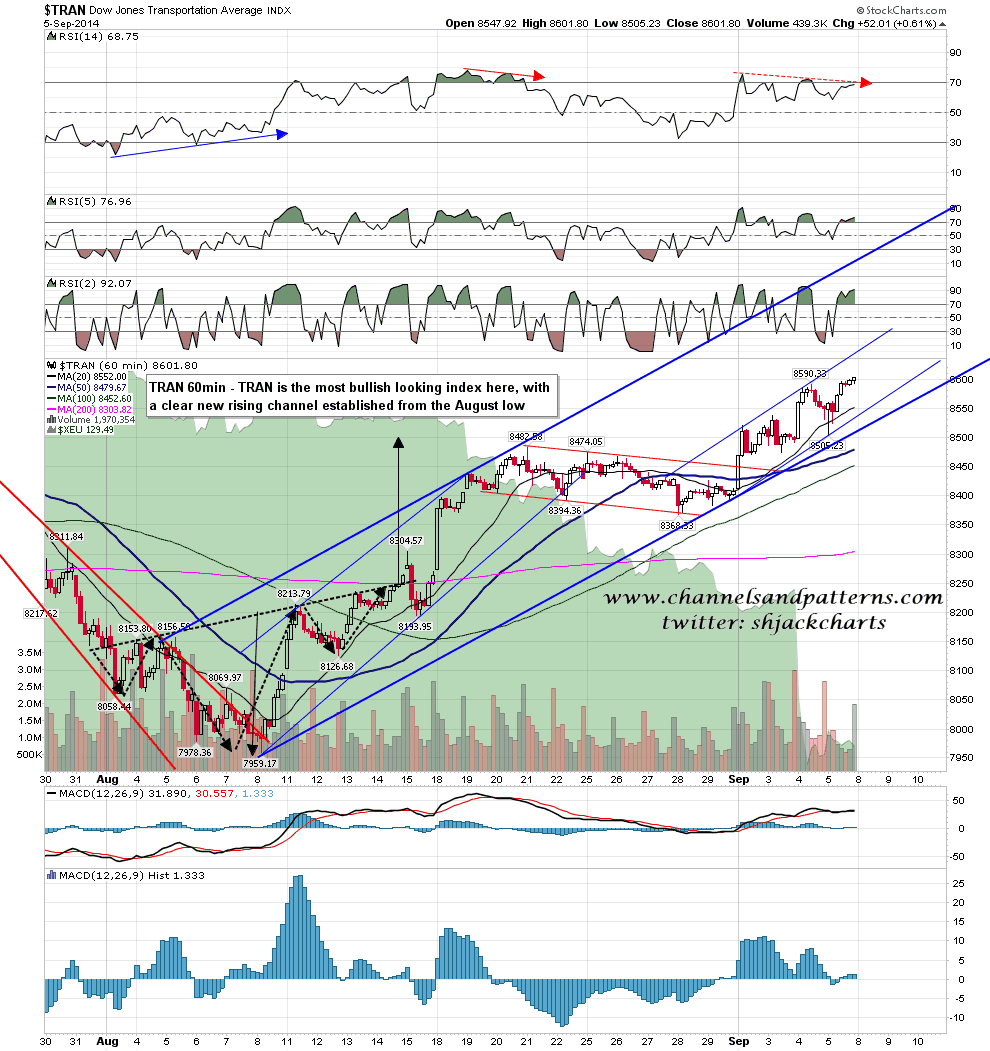
I had a look at all the main US equity indices without getting much illumination as to the next move here, though a large rising channel has now formed on TRAN from the August lows, and that’s bullish as long as it lasts. TRAN 60min chart:
TLT is looking interesting, as it has broken short term rising channel support, and the rising channel from 99.16 may well have evolved into a rising wedge. There is decent support in the 115 to 115.5 area, but if that breaks then rising wedge support is currently in the 113.7 area. That trendline is main uptrend support for TLT. TLT daily chart:

Oil has been chopping around and there is a possible double bottom forming there. I’m not expecting that to play out however and am looking for the next important support range in 90.5 to 91.24 area to be tested before any decent possibility of trend reversal. WTIC daily chart:

ES has come off somewhat overnight, and that may develop into a strong decline this week, with a target at 1969 SPX on a break under 1990. The stats say that a new all-time high from this position would be an extreme rarity, but if we see that new high, then the obvious target would be the 2030 area. Which way will this break? Well, in recent years when the bears have had a ball to drop, they have usually dropped it, so I’m leaning short, but very much not counting the bull case out here despite the historical odds against them.
