
To the casual eye, nothing of great interest happened on Friday, with a larger than usual dip that was bought, and more than half recovered by the close. Superficially that was just a third day riding the upper band and if we see a very strong recovery into and at the open, it’s possible that SPX could put in a fourth upper band ride day today. SPX daily chart:

But a look under the hood on Friday told a different story, as I mentioned a couple of times on twitter on Friday night. The low on Friday broke the first important support level of the three that I gave on Friday morning, and that level was rising wedge support from the 1978 low.
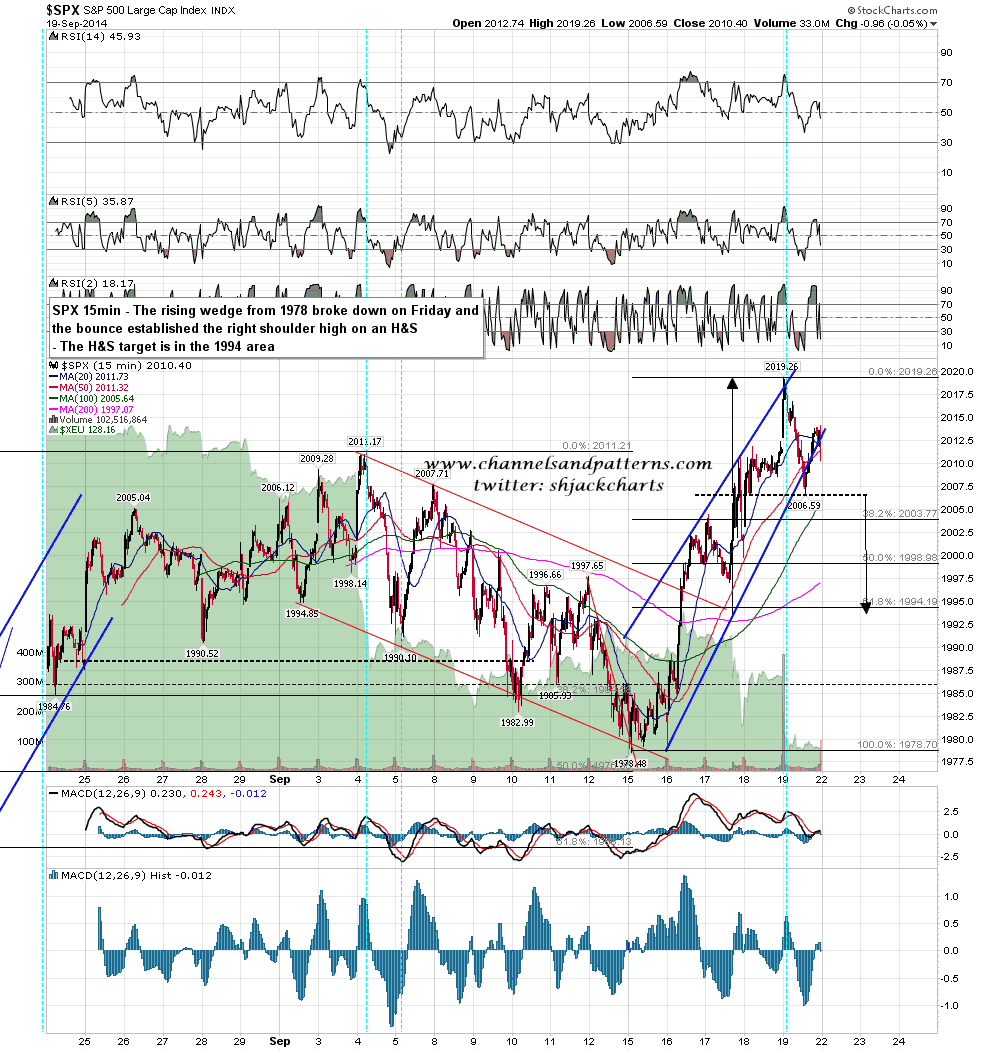
Now after a rising wedge breaks down there are two main options. If the uptrend is continuing then a retracement should start that would generally bottom near one of the main fibonacci retracement levels, the 38.2%, or 50%, or 61.8% retracement areas. If the uptrend is over, when that rising wedge is an Elliott Wave ending diagonal, then the retracement should retrace to the bottom of the rising wedge, in this case 1978 and the third of the important support levels that I gave on Friday morning. Either way a topping/reversal pattern should form if it has not already formed, usually a double top of some kind but sometimes an H&S.
After the rising wedge support break I had a look at the break low and saw that the target for a double top or H&S from that low should be in the 1994 area, close to the 61.8% fib retracement level at 1994.19. I was looking for the second high of a double top but SPX went slightly over the ideal H&S right shoulder high and failed hard there. Looking at ES overnight, SPX may well gap below that H&S neckline at the open, triggering that 1994 area target. To get there it would need to break below the second line of support that I gave on Friday morning, which was the SPX 50 hour MA, now at 1997. SPX 15min chart:
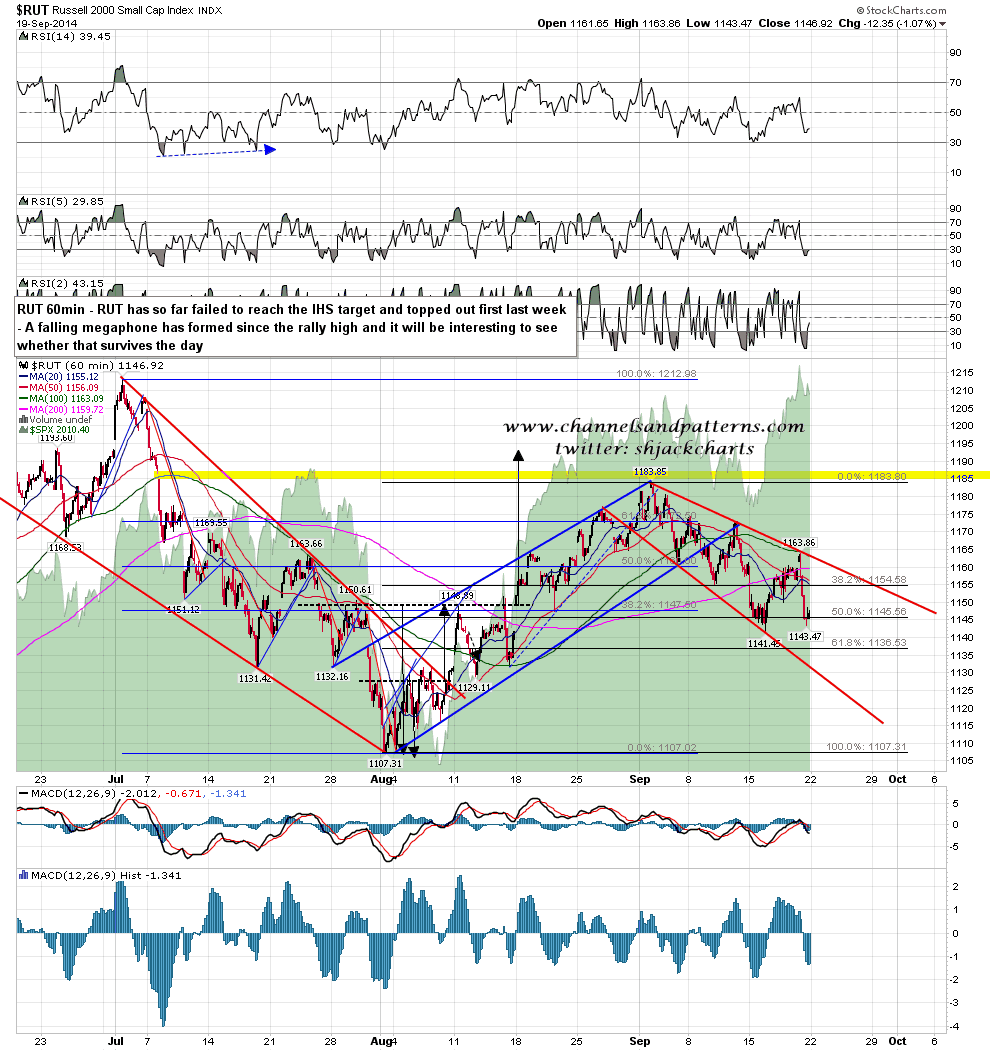
Other indices with the exception of RUT and TRAN are all sporting decent looking short term double top setups. TRAN doesn’t look particularly interesting, but RUT topped out first and has formed a falling megaphone that looks interesting and I’ll be watching that today. RUT 60min chart:
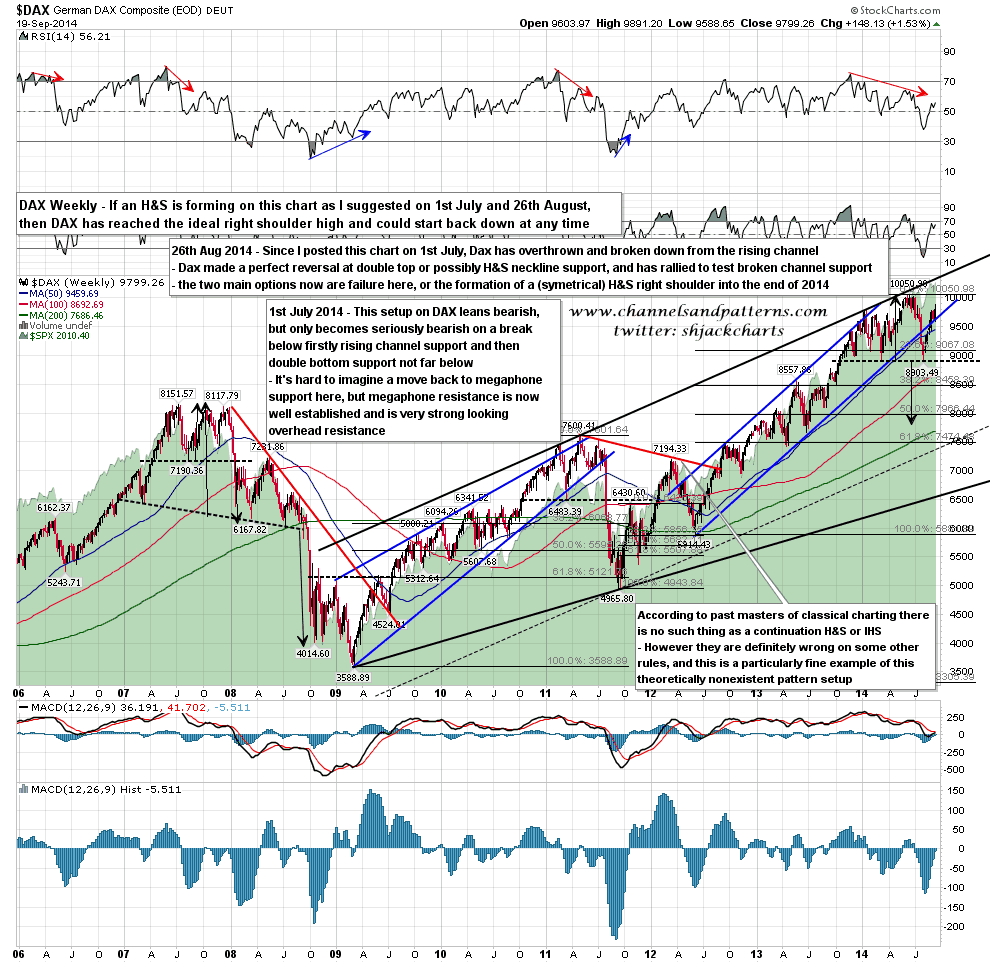
What happens if all the the three levels of support that I gave on Friday morning are broken? Well at the least I’d be looking for a move on SPX to the (double top target in the) 1940 area, but there is a possibility that we could be looking at a significant interim top here at the end of QE3, to match the tops we saw at the ends of QE1 and QE2. There are large topping patterns part-formed on most US indices, but this DAX chart that I’ve been following shows eloquently where such a high might be headed. On DAX that topping pattern would be an H&S and at the least I’d be reluctant to be long any chart like this. The trigger level for the possible double top on SPX would be a break below the 1904 low, and that would current target the 1789 area for a retracement just over 10%. DAX weekly chart:
The first important support level that I gave on Friday morning was SPX rising wedge support from 1978, and that broke on Friday. The second important support level is the 50 hour MA, currently at 1997, and there is obviously a setup here to test that today. If bears can break that with any confidence that will break the uptrend from 1978 and open up a possible test of my third and last important support level at 1978. If that level breaks then the double top target would be in the 1940 area, and any decline into that might well open up a test of the 1904 low.
Meantime though bears still have a lot to prove. We’ll see how they do today.
