
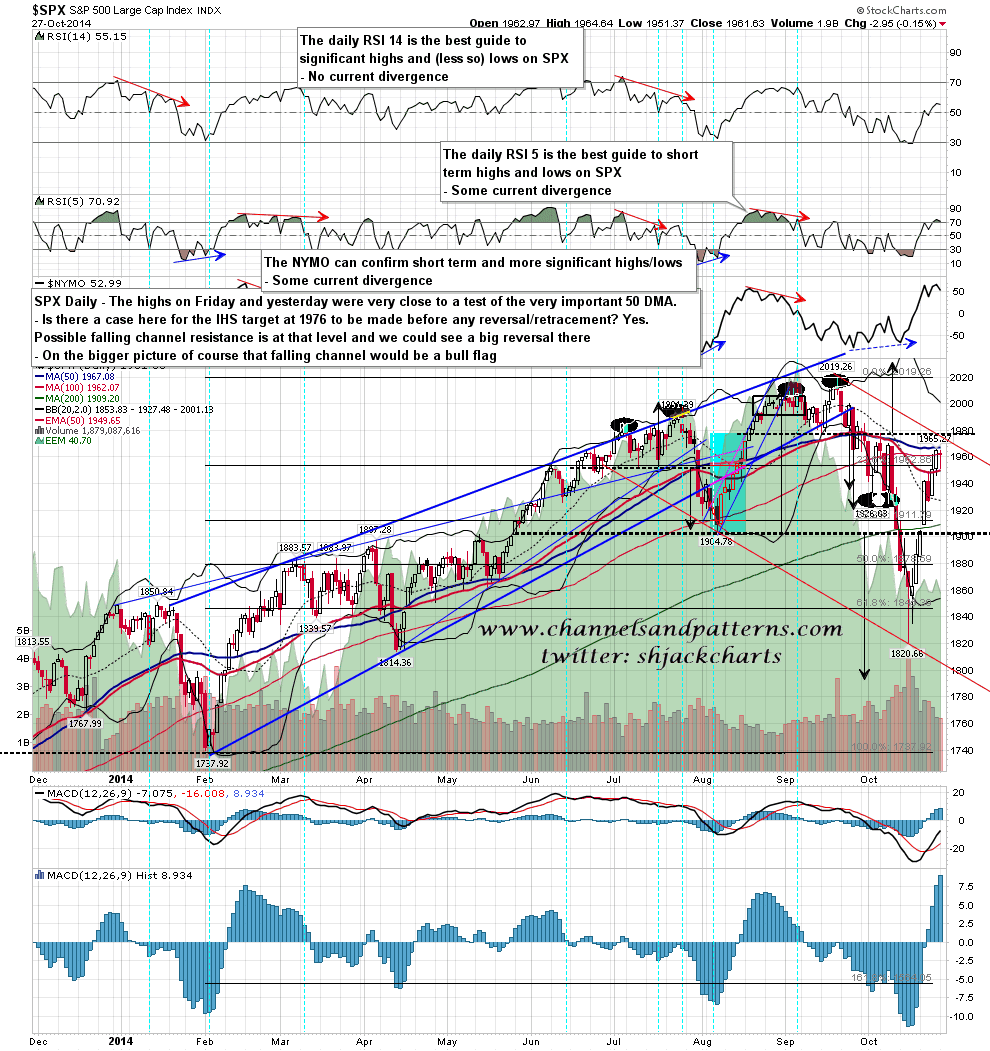
I was talking yesterday about the 1976 SPX target and the trendline resistance that may well be there. SPX is likely to gap up today and we will see whether that target is hit today and if so, whether the trendline holds. SPX daily chart:
Supporting that 1976 SPX target is a triangle that formed on the SPX 1min chart yesterday. It made a false break down, as triangles often do, and is now resolving up towards the target, which is also at 1976. SPX 1min chart:

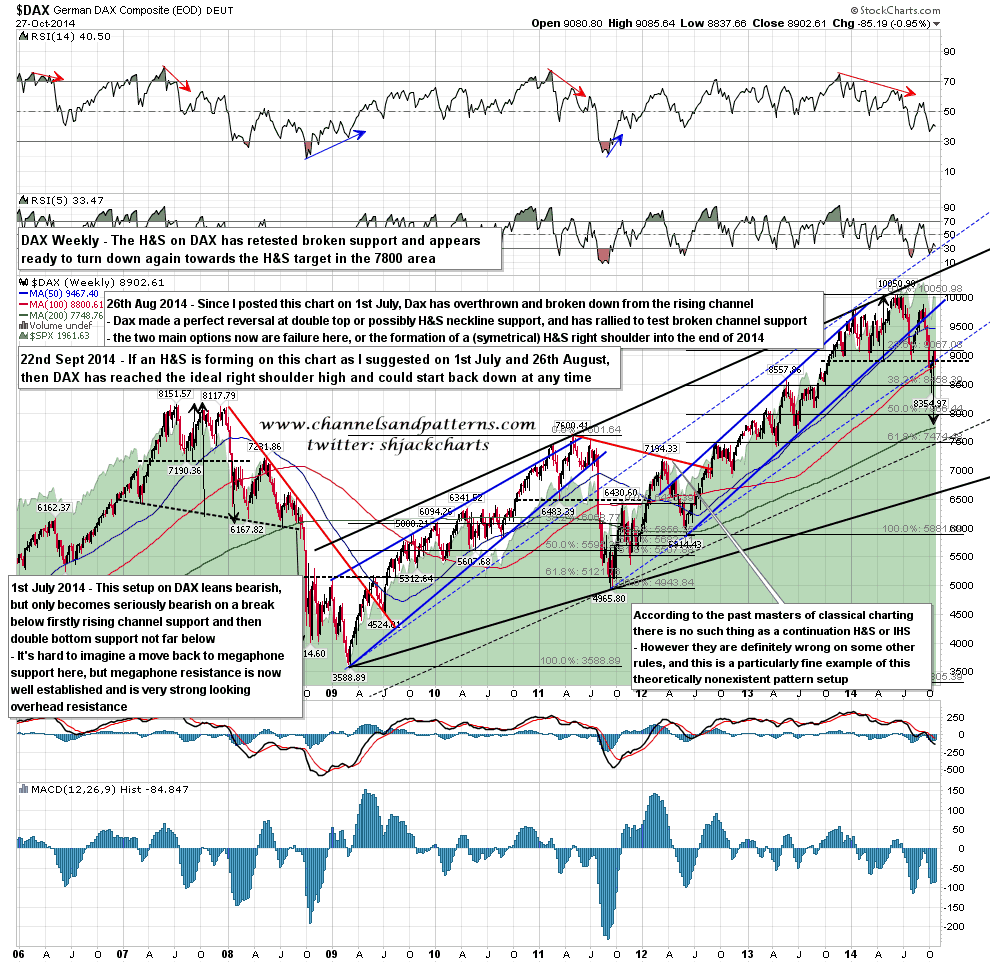
What will happen at that 1976 SPX test? Hard to say but a look at foreign indices suggests strongly that there may be another strong wave down starting shortly. Whether that would have the strength to carry SPX past the 1820 low from here is debatable of course. DAX weekly chart:
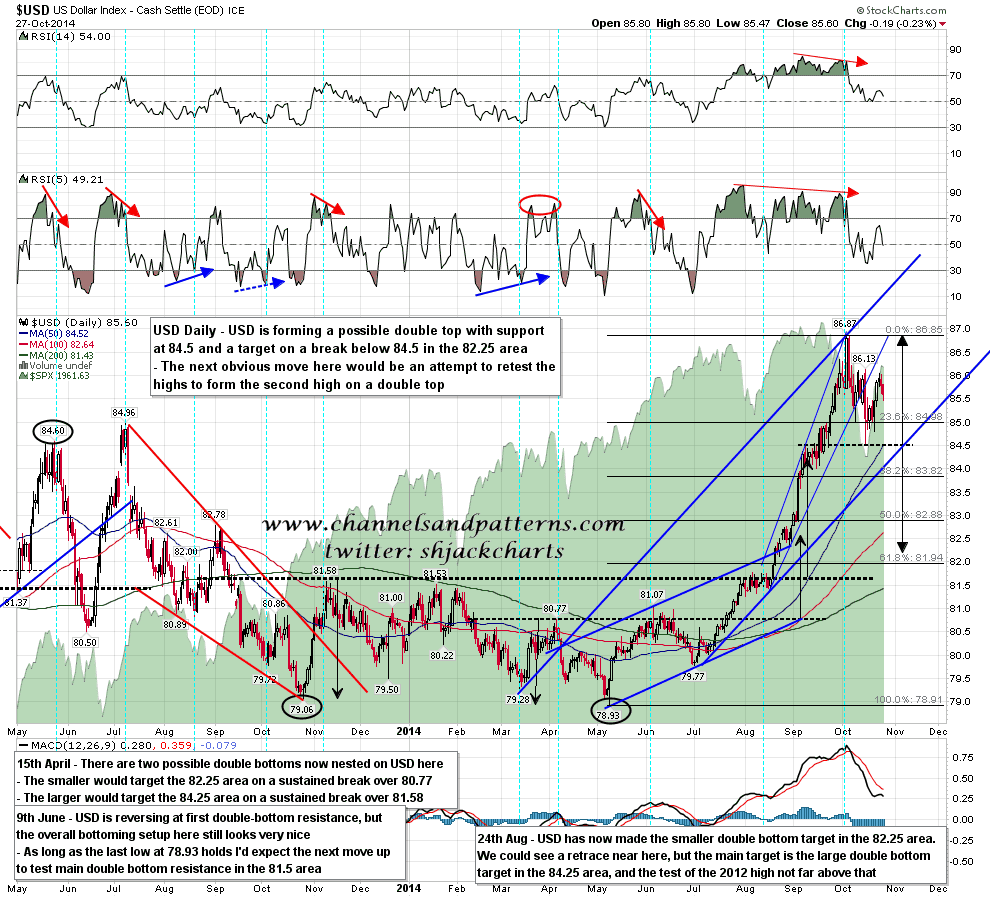
I haven’t posted a USD chart in a few days. The obvious next target is still a retest of the current high before a larger pullback. USD daily chart:
The 1976 SPX should be tested today. If we are to see a test or more of the 1820 low I would expect a strong reversal very near there at the trendline I have drawn on the daily chart. If we are to just see a retrace of the current move then SPX may run up another few points but that retracement is likely to start soon. Any significant downside on the 60min charts would now be likely to trigger 60min sell signals across the board.
