
It has been a great run long and short over the last few weeks, and within reasonable tolerances, I’ve called every turn on SPX since I went on holiday in mid-June. Does this mean that what I am expecting to happen here must happen? No, it doesn’t work like that. As I was saying on Friday, the downside scenario is the higher probability path here, and I’m giving 75% odds of a bearish resolution here. That means that I am giving the bulls 25% odds of breaking up to new highs on SPX, and of collapsing the bear scenario that I have been following as it has formed over the last few months. 25% is not a small percentage and it could very much happen. No-one should mortgage the family farm to go short here.
I call the market very well, but no-one can know the future. Anyone who says they do is either deluding themselves, or trying to delude others, or both. Always consider the possibility that any trade can go the other way, and have a plan for that too:

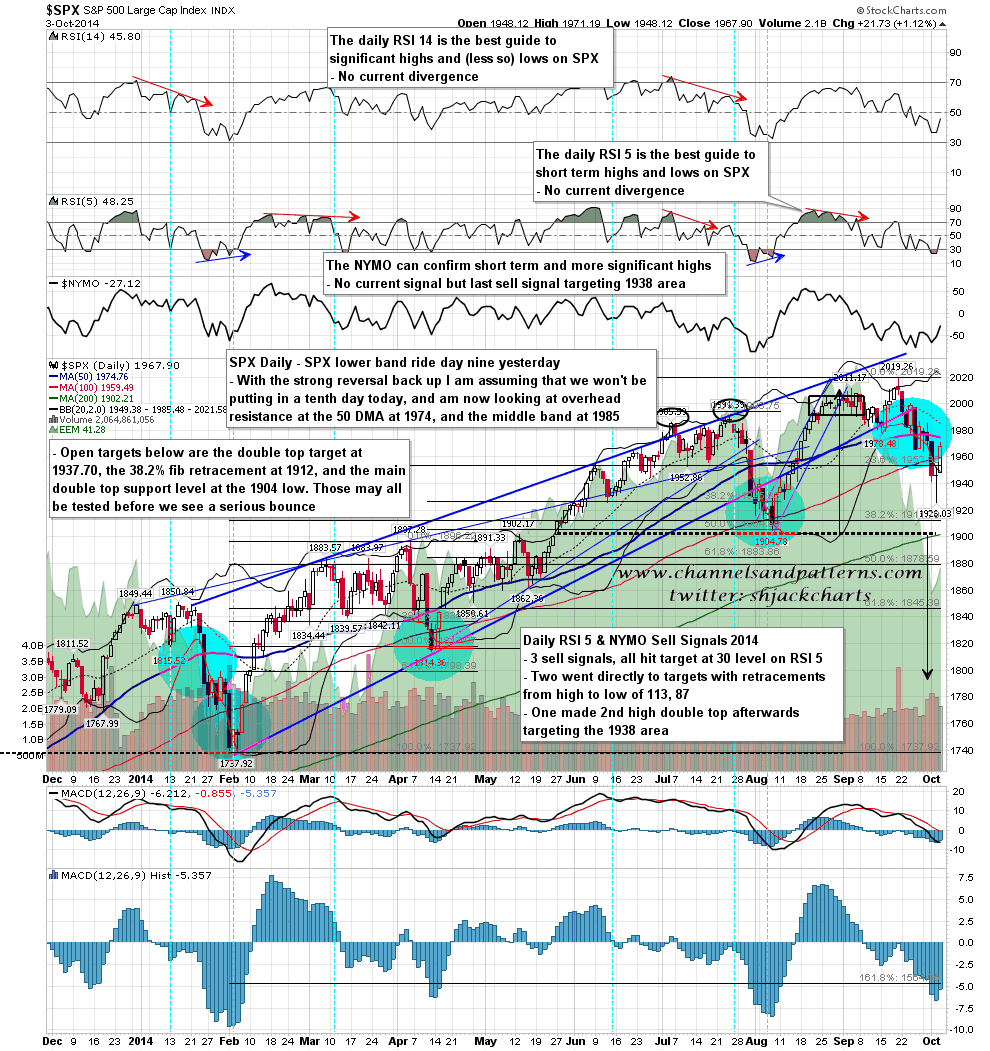
On the daily chart Friday was the ninth day of the lower band ride and, assuming that we don’t see a very strong reversal today, the last day of that lower band ride. Overhead resistance is at the 50 DMA at 1974, and the middle band at 1985. My ideal high here, obviously on the bear scenario, would be for a high to be made today or tomorrow, with SPX opening and closing the day at or under the 50 DMA, with an intraday test of middle band resistance at 1985. SPX daily chart:
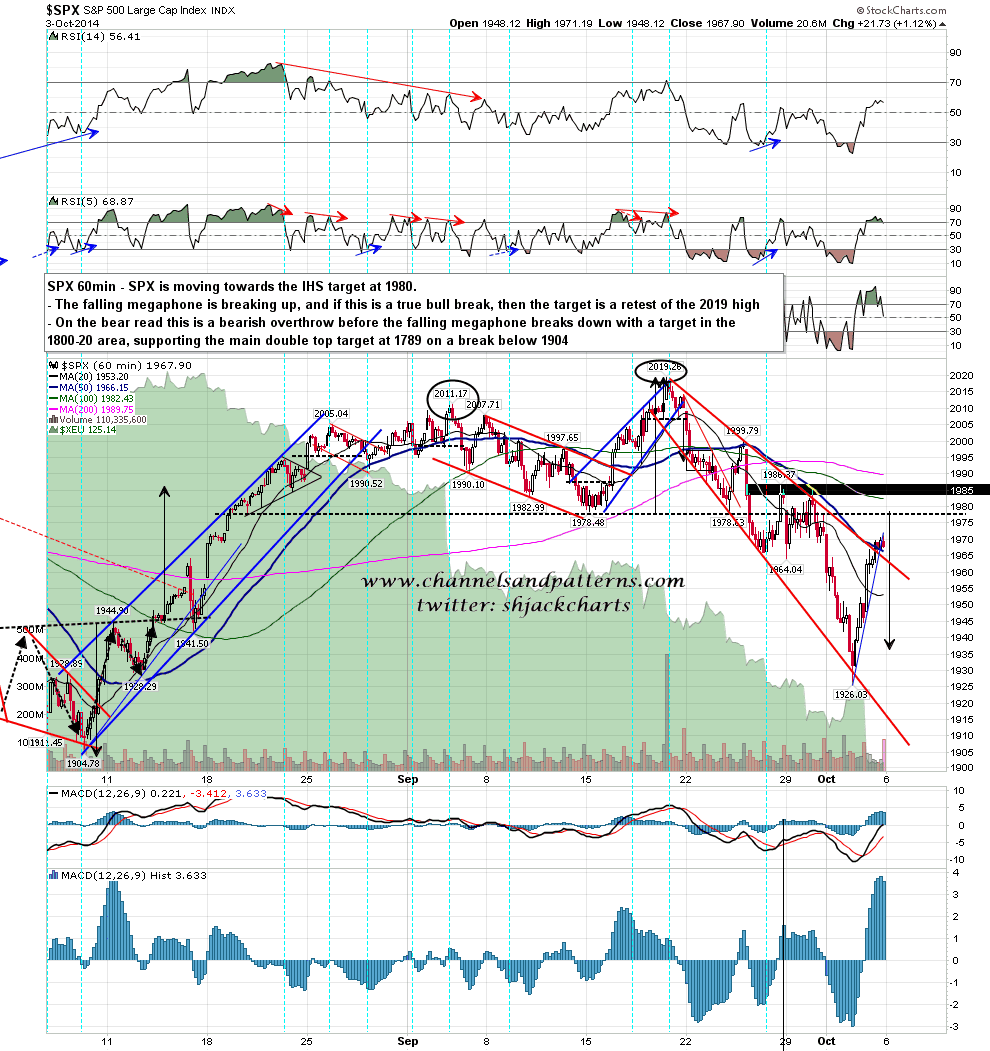
The target of the IHS I was looking at on Monday morning is 1980, and both falling megaphone resistance and the 50 hour MA broke on Friday afternoon. I have a zone with multiple resistance levels from 1978 through 1990, with the main area at 1983-7. That’s where I would ideally like to see an intraday high before a strong reversal. SPX 60min chart:
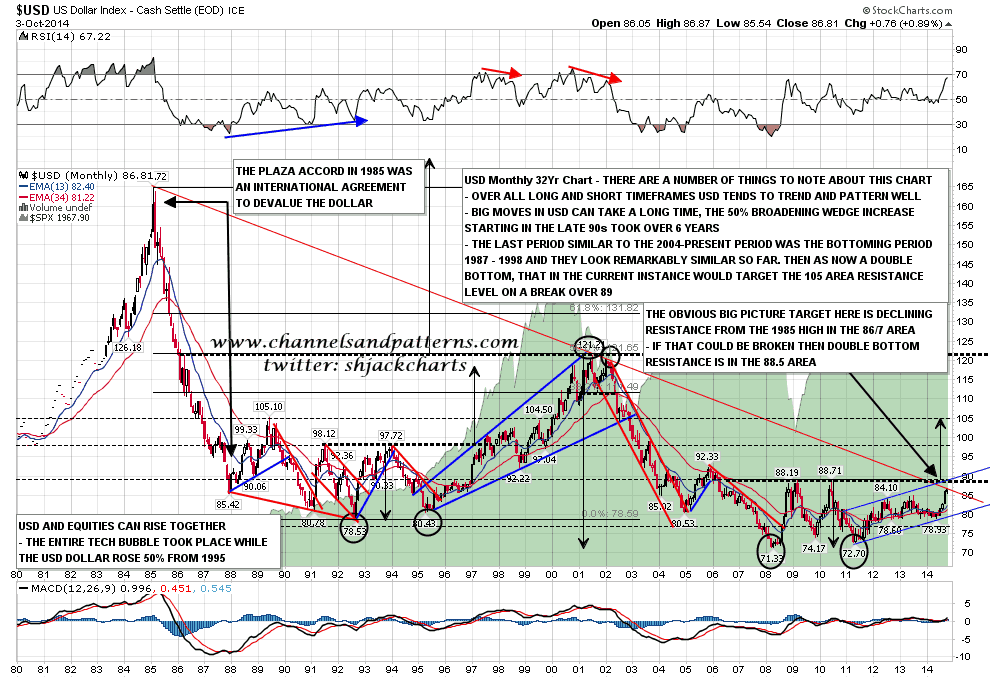
USD had another strong week last week and I was asked whether declining resistance from the 1985 high had broken. The answer is no, and to show that I have thinned that declining resistance trendline down to show that the test is exact so far. A move to 88 would be a break up. USD monthly chart:
I’m looking for some retracement soon before the last move up to test the 1978-90 resistance zone. Rising support from the low last week broke late on Friday afternoon, so ideally that retracement would be this morning.
