(First off, to any American readers, I hope you all had a wonderful Thanksgiving season gorgefest and good times with your families. You will need the energy as we all prepare for the coming onslaught of decorating, carols, and christmas shopping in the coming weeks!)
Now, as I’m sure all are aware, Thanksgiving week was a snoozer for movement. Despite that fact, market participation is strong across the board (with the exception of commodity-related equities which have been getting smacked around) and are not giving back any serious ground despite elevated levels. When these conditions persist, they tend to cause shallow, grinding moves in the indices. Moves like this can carry on for weeks or months.
Here is a chart of the VXV (3-month implied volatility) compared relative to the $VIX (1-month implied volatility). It creates a ratio with which we can measure what option players are anticipating for the coming month(s). Click to enlarge.

When the ratio is high, it shows that 3-month volatility is being priced higher than front month volatility. The ratio itself is now on the extreme high end of its recent range. I choose to draw my chart with “sell” signals being drawn when the ratio starts retreating out of an extreme high. When these signals occur, it shows that either short-term IV is being priced up close to 3-month IV OR that 3-month IV is being priced down closer to short-term IV levels. Either way, typically after these occur (thin, red, vertical lines), price trades more flat (or shallow) than directional. The only time it traded down was on a 3rd test of a recent high. Current conditions are not like that so I am expecting more of the same grinding action going forwards, unless something changes.
Here is my basic SPX chart as I currently see it.
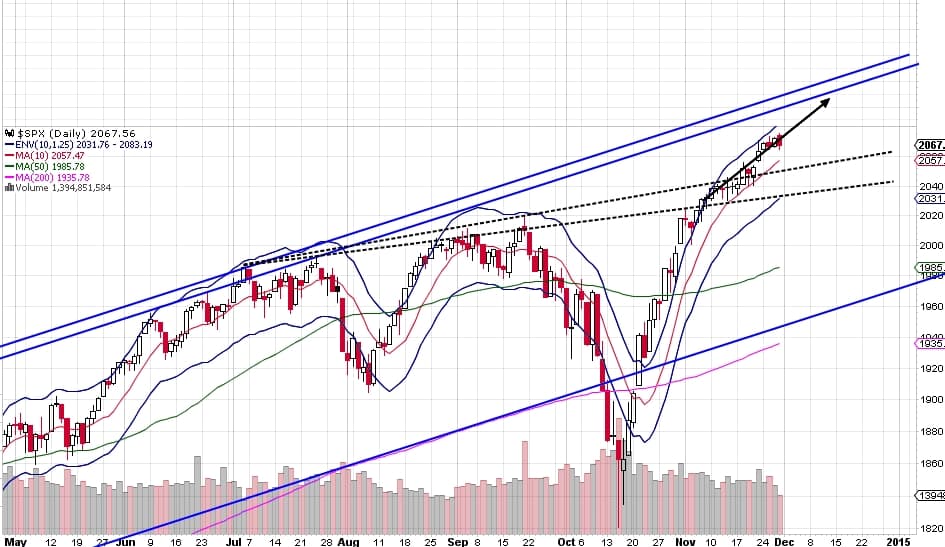
The old channel high is somewhere up around the 2100+ level. All indications as of Friday’s close are to buy any dips that materialize. I will be waiting to see what price does once volume comes back in on Monday to decide my plan for next week. Given the typically low volatility in December, I do not think that any significant selling is in the cards before 2015.
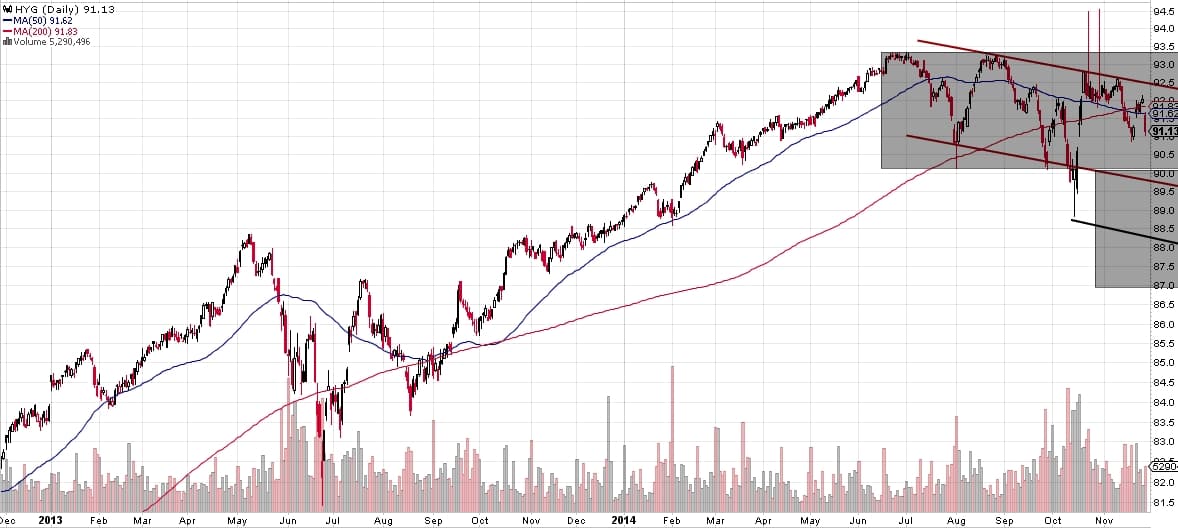
One chart on my radar is HYG (corporate bond fund). It has been underperforming long-term bonds all year along with JNK and shows some risk aversion in the market as also evidenced by strong performance in defensive sectors like staples and utilities. HYG has been staying rangebound in recent months and revisiting major lows. I expect to be seeing much lower lows over the coming year. For option traders, the option spreads aren’t terrible on this (10c spreads for January ATM options).
Good luck next week!