
SPX had a strong decline yesterday that broke below the 50 hour MA with confidence and made the low of the day at the daily middle support at 2055 that I had mentioned in the morning. The retracement I have been looking for after the break of the daily run above the 5 DMA appears to have started, and SPX seems likely to gap below daily middle band support at the open. What should we expect next?
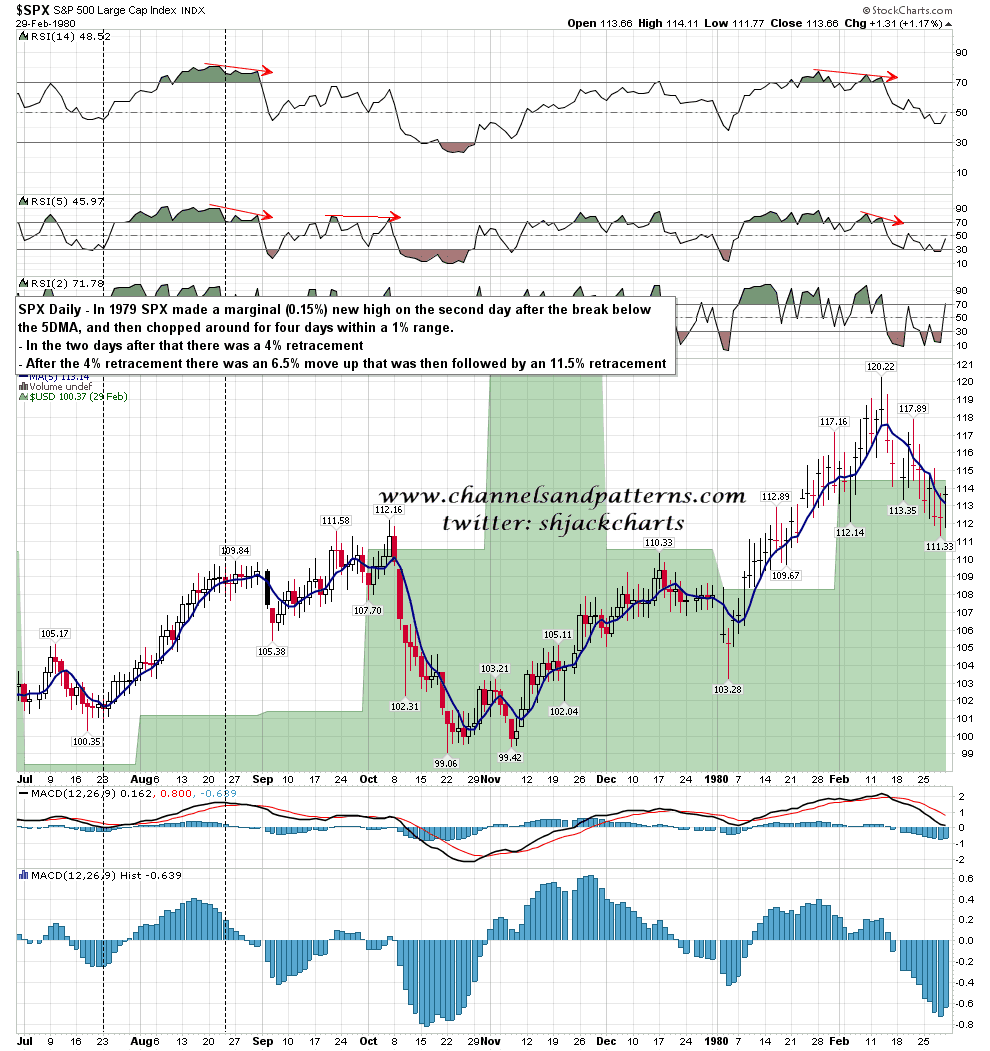
The smaller of the two directly comparable post 5 DMA run retracements was 2.2% in 1991, which would target the 2033 area here. The larger of the two retracements was 45 in 1979, which would target the 1996 area here. I’ll be using these two numbers as the top and bottom of the likely target range here, though obviously with a sample size of only two the range is just a working hypothesis rather than a firm target. Here is the 1979 chart which was a strong move down that only took a couple of days. SPX 5 DMA chart 1979:
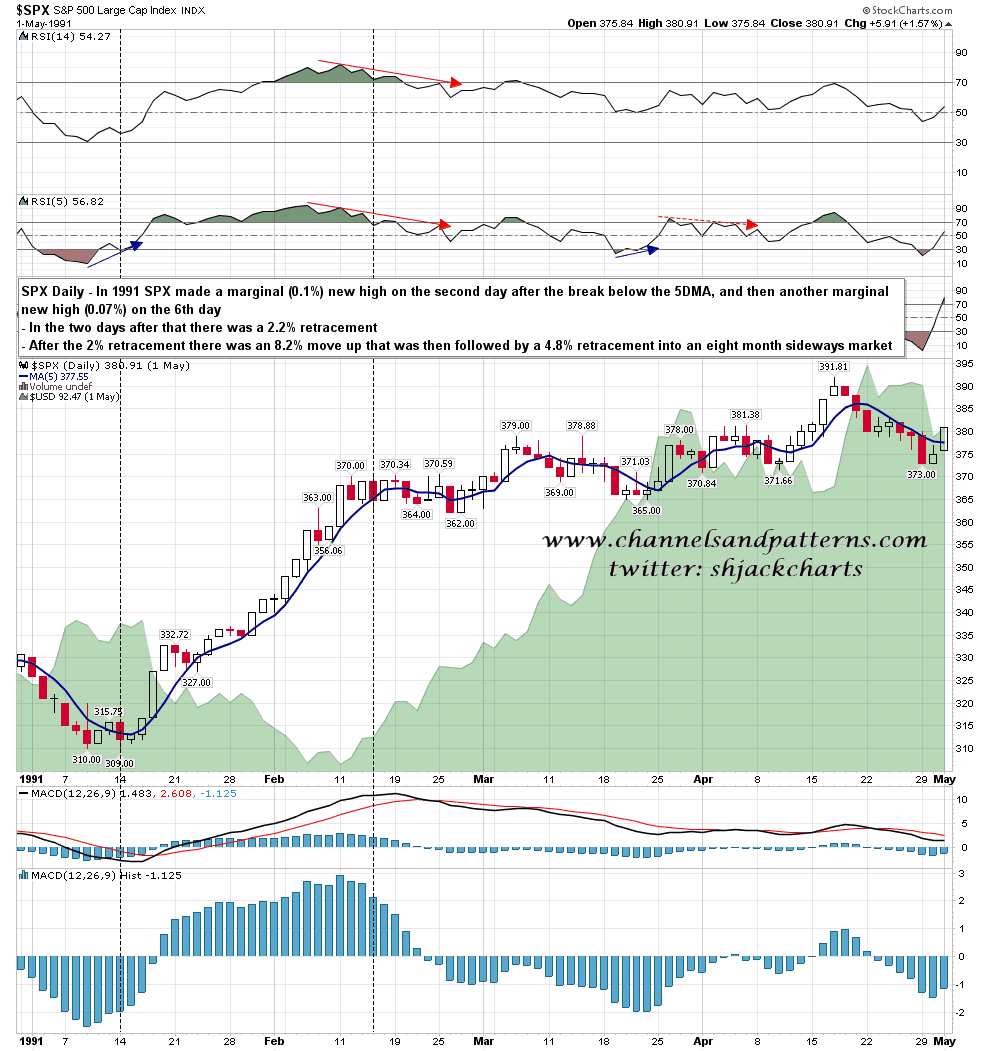
The 1991 retracement was more of a range trade but it’s worth noting that in both case the retracement low was made on the eighth trading day after the 5 DMA run broke. Today is the seventh day since the recent 5 DMA run broke so we may well be looking at a fast and hard retracement that could end anywhere from today through Thursday if we follow the same sort of timeframe. SPX 5 DMA chart 1991:
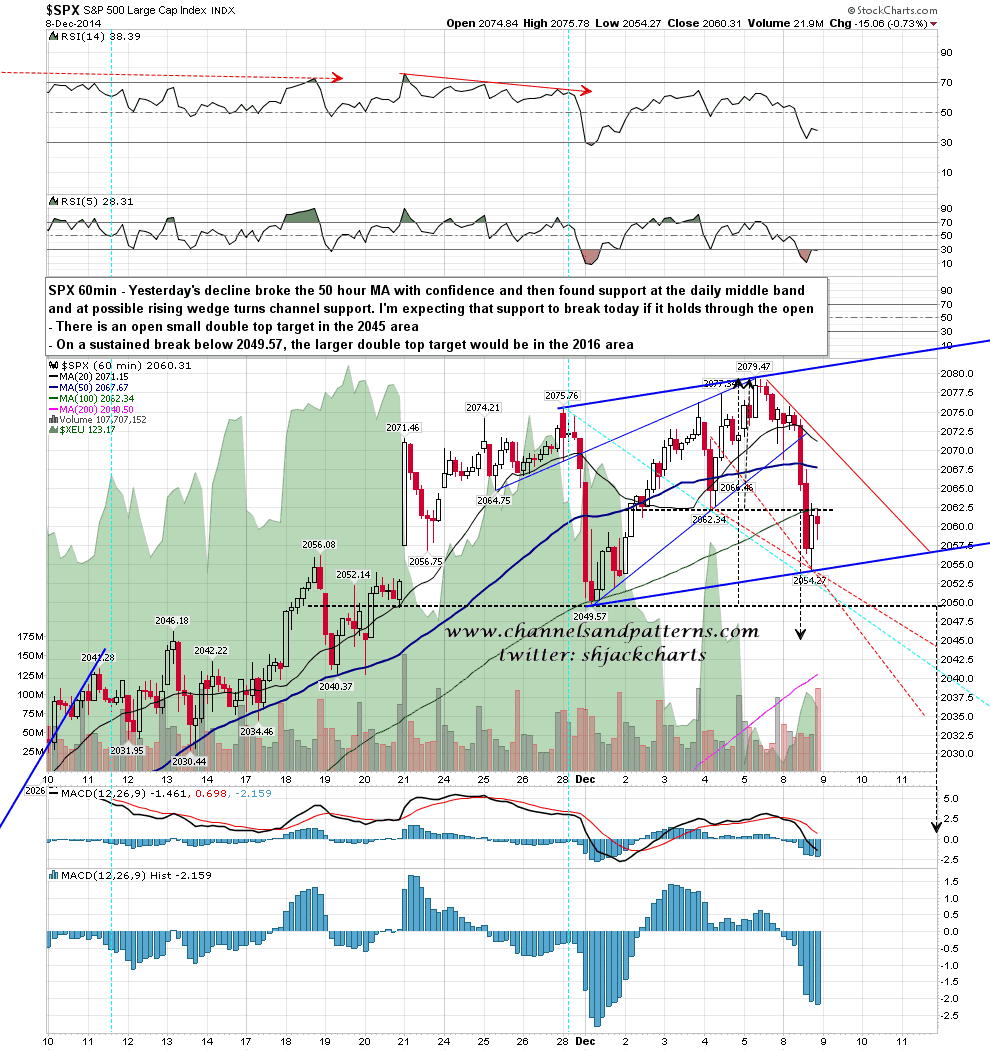
What are the important levels to note here? Overhead important resistance is now at the daily middle band at 2056, and the 50 hour MA, now at 2068. I would be surprised to see a break over the 50 hour MA before this retracement is over and the next leg up has started. There is an open double top target at 2045 that may be hit at the open and on a sustained break below last week’s low at 2049.57 there would be a large double top target at 2016. SPX 60min chart:
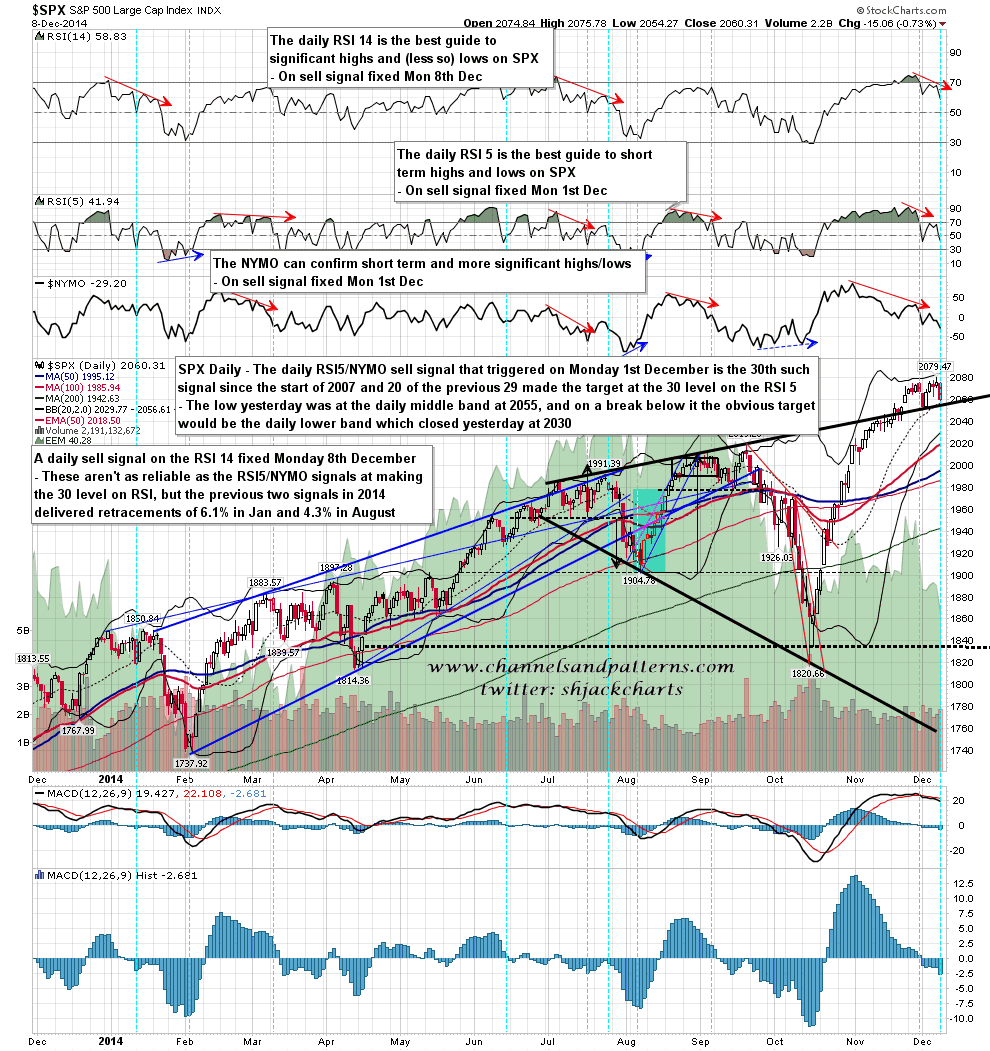
On the daily chart I’m looking for support at the daily lower band, which I’m expecting to be at the 2033/4 level today. If we see a move to the bottom of the target range I’d be looking for support at the 50 DMA, currently at 1995. SPX daily chart:
On thing I’ll mention again today is that though there were differences in the timing and size of the retracements after these past 5 DMA runs ended, one thing was the same in every case, and that was that the retracements were swiftly followed by a continuation of the uptrend. There are quite a few people looking for a major high here. The historical stats and seasonality don’t support that.
