
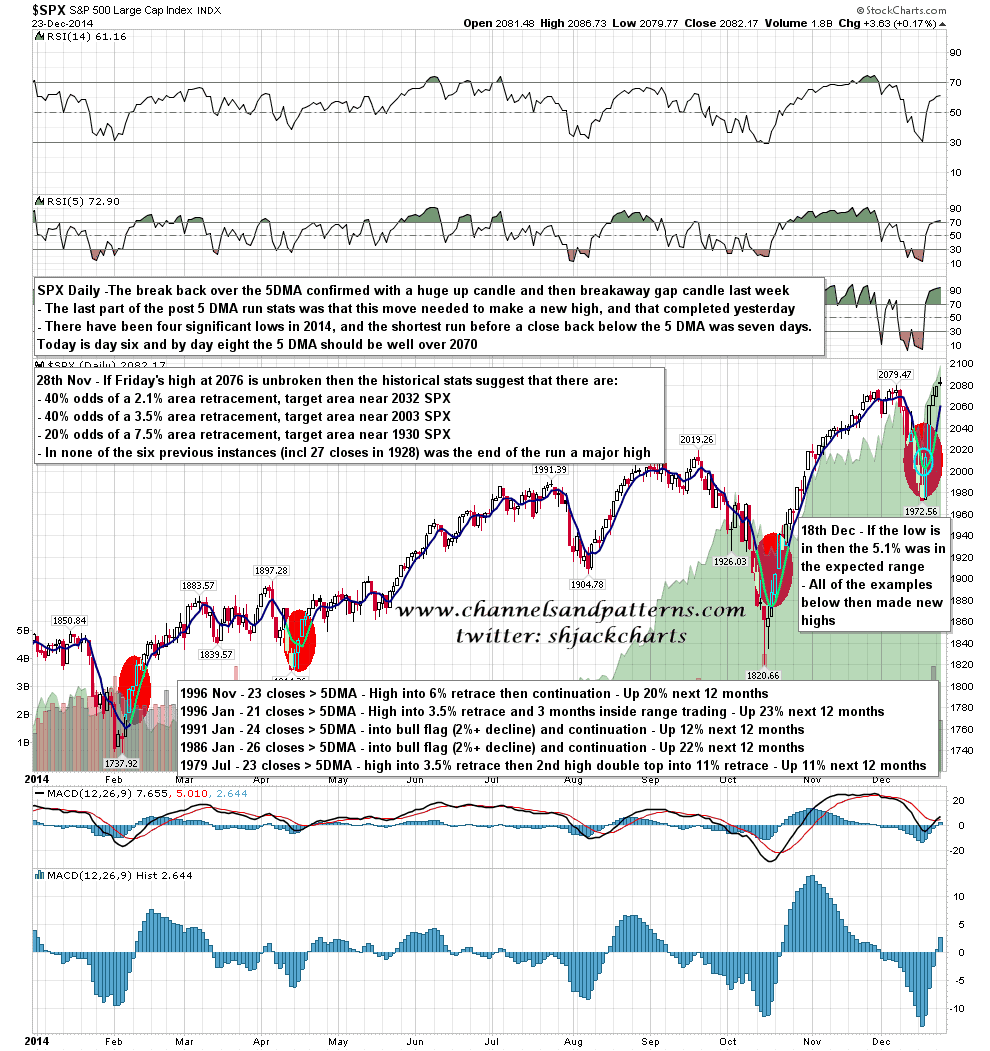
SPX made a new all time high yesterday, so the stats I posted a month or so ago for what had happened in the past after big 5 DMA bull runs have now all played out, with everything within the expected ranges. This is a good illustration of why it’s often worth crunching some numbers after a rare setup like the all time record run in November of consecutive daily closes above the 5 DMA. The last small thing to take away from the chart below is that I would expect a minimum of two more daily closes above the 5 DMA, which should be over 2070 SPX by the close on Friday. SPX daily 5 DMA chart:
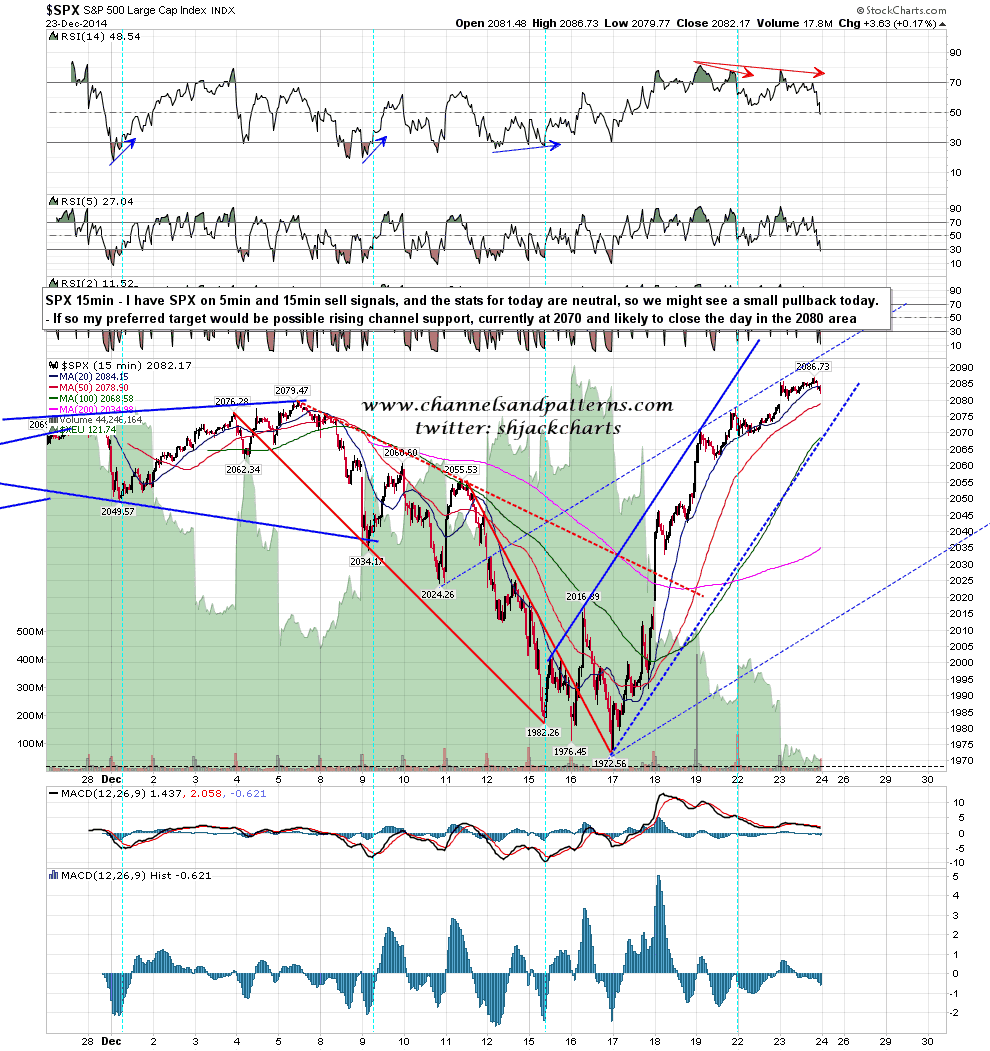
The stats for the last two days have been historically very bullish, but that’s not the case today. If we see some weakness, and we might, then I have a target trendline in the 2070 SPX area at the open today, rising to about 2075 by the early close. SPX 15min chart:
Apologies for the late post today. I’ve been out doing the last of my Xmas shopping. Everyone have a great Xmas/Hanukkah/Holiday and my next post will be on Friday morning. 🙂
