
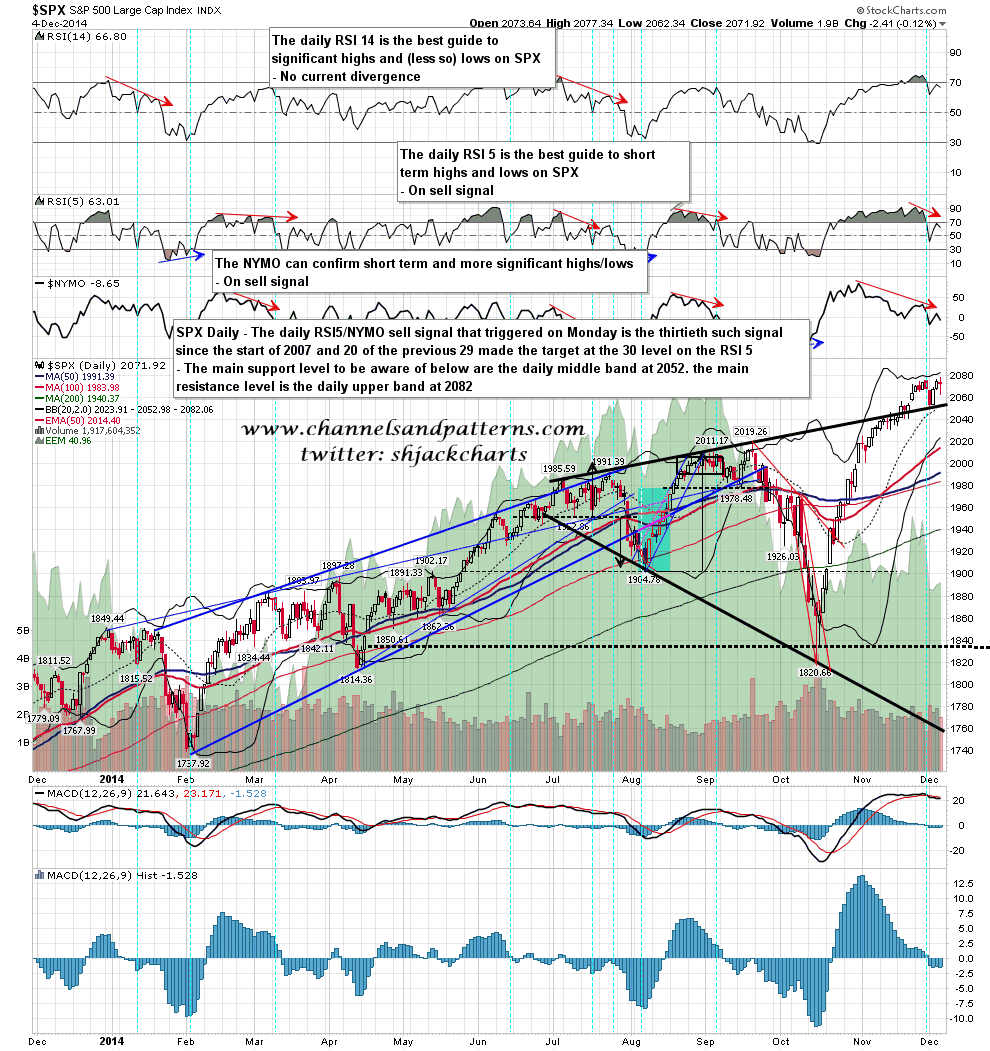
SPX made yet another marginal new high yesterday making a total of five new all time highs over the last two weeks, all in the 2070s within a total range of less than six points. That’s a lot of effort from the bulls to fail to get get over what has so far been extremely stiff resistance. In the event that the bulls are unable to push through this resistance , or spike through but can’t sustain trade over the 2070s, there is now a very nicely formed pair of nested double tops lighting a path down to a retest of broken resistance at the 2019 high. SPX 5min chart:

If we do see a break up it may be short lived. Resistance at the daily upper band closed yesterday at 2081, and the weekly upper band and strong trendline resistance are in the 2092-5 area. If we see a break up then it may well be rejected quickly. SPX daily chart:
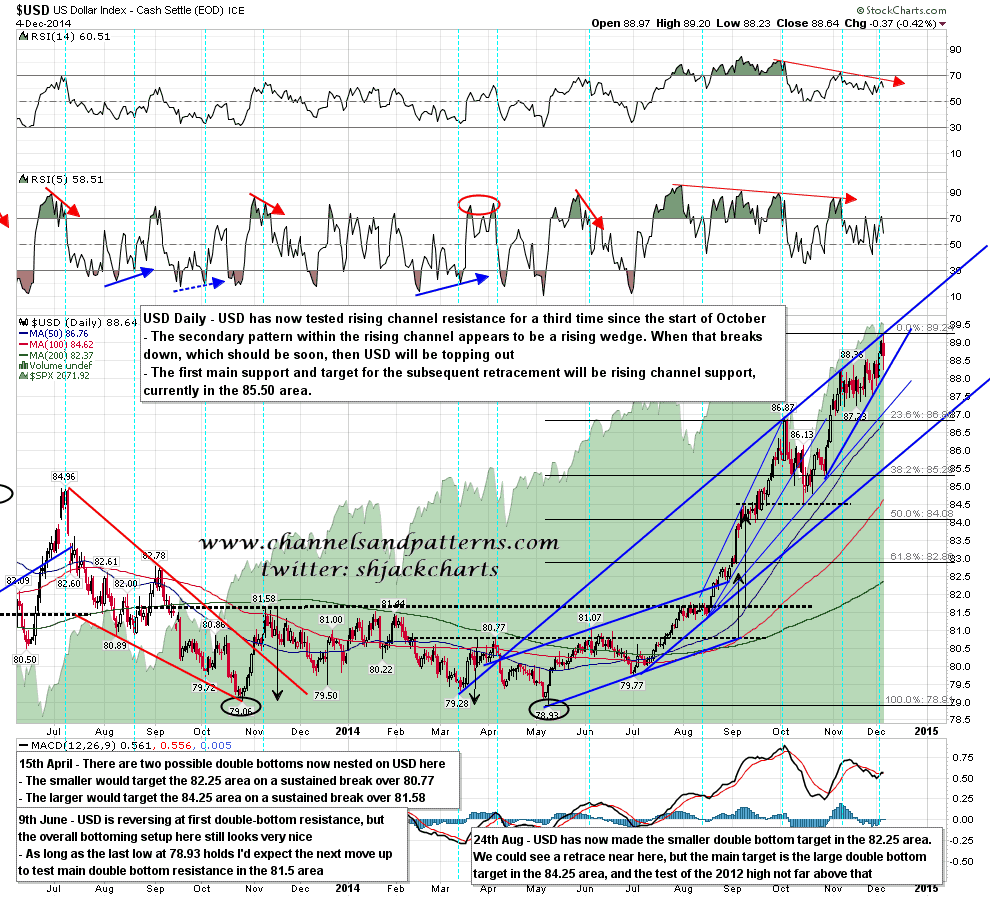
My rising channel on USD that I have been posting for the last couple of months is holding well, with USD riding up the channel resistance trendline. The internal pattern is a rising wedge and when that break down we should see a move to test channel support, currently in the 85.50 area. USD daily chart:
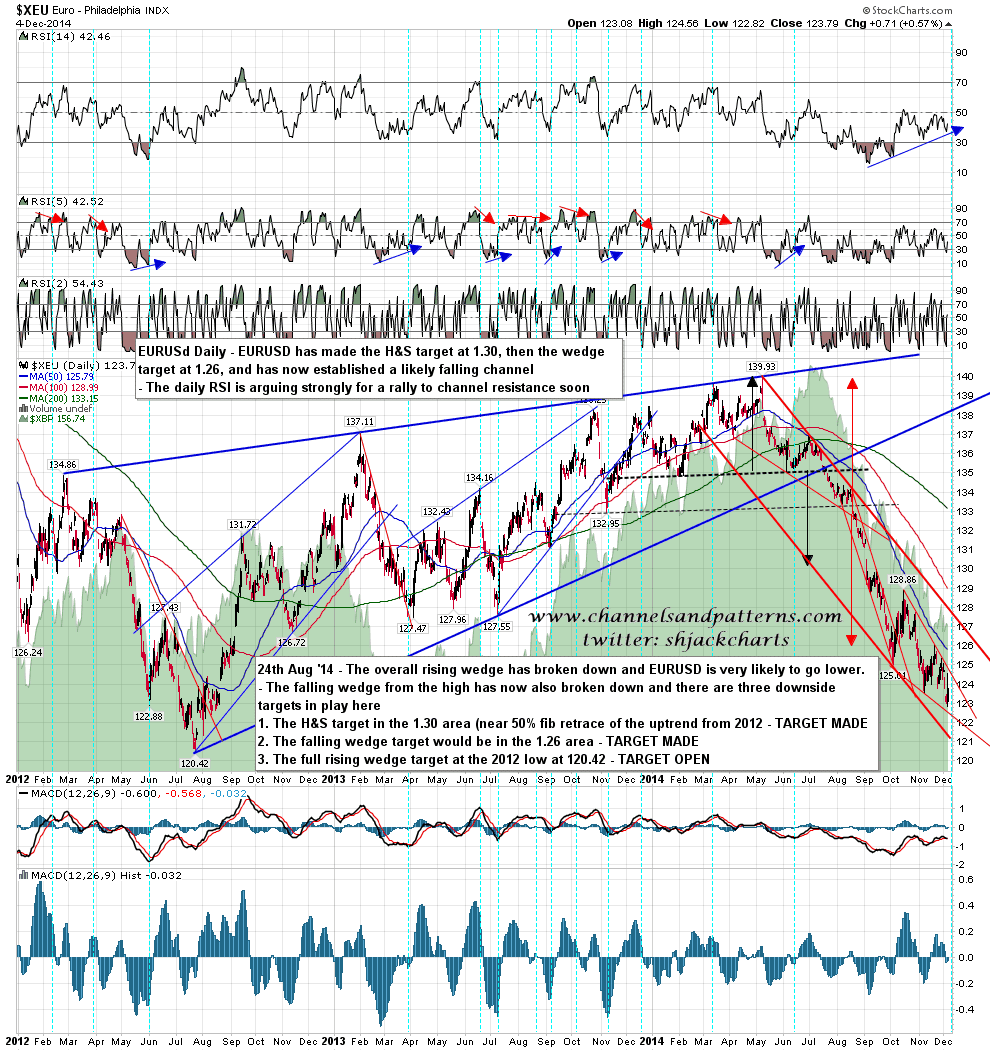
EURUSD is a distorted reflection of USD as I would expect, with EURUSD being 57% of the USD index. There is a falling channel there and and internal falling wedge that should signal a move to test falling channel resistance on a break of that wedge. EURUSD daily chart:
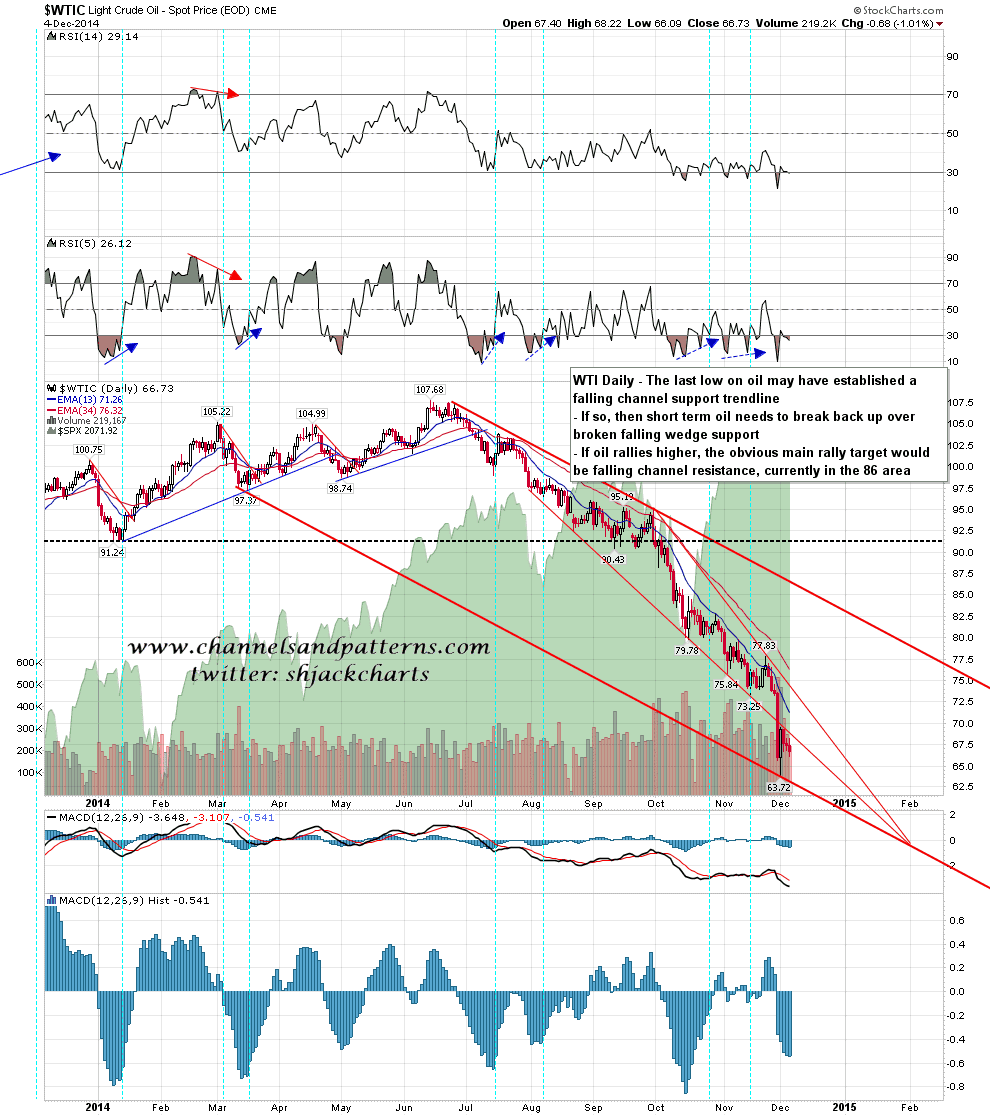
I’ve gone back to the drawing board on oil after the epic drop last week. I think the current low may well have established the support trendline on a falling channel and if so, I’ll be looking for a rally into channel resistance, currently in the 86 area. There is another intra-channel falling wedge on oil here as well, but in this case it broke down last week and is retesting wedge support. WTIC daily chart:
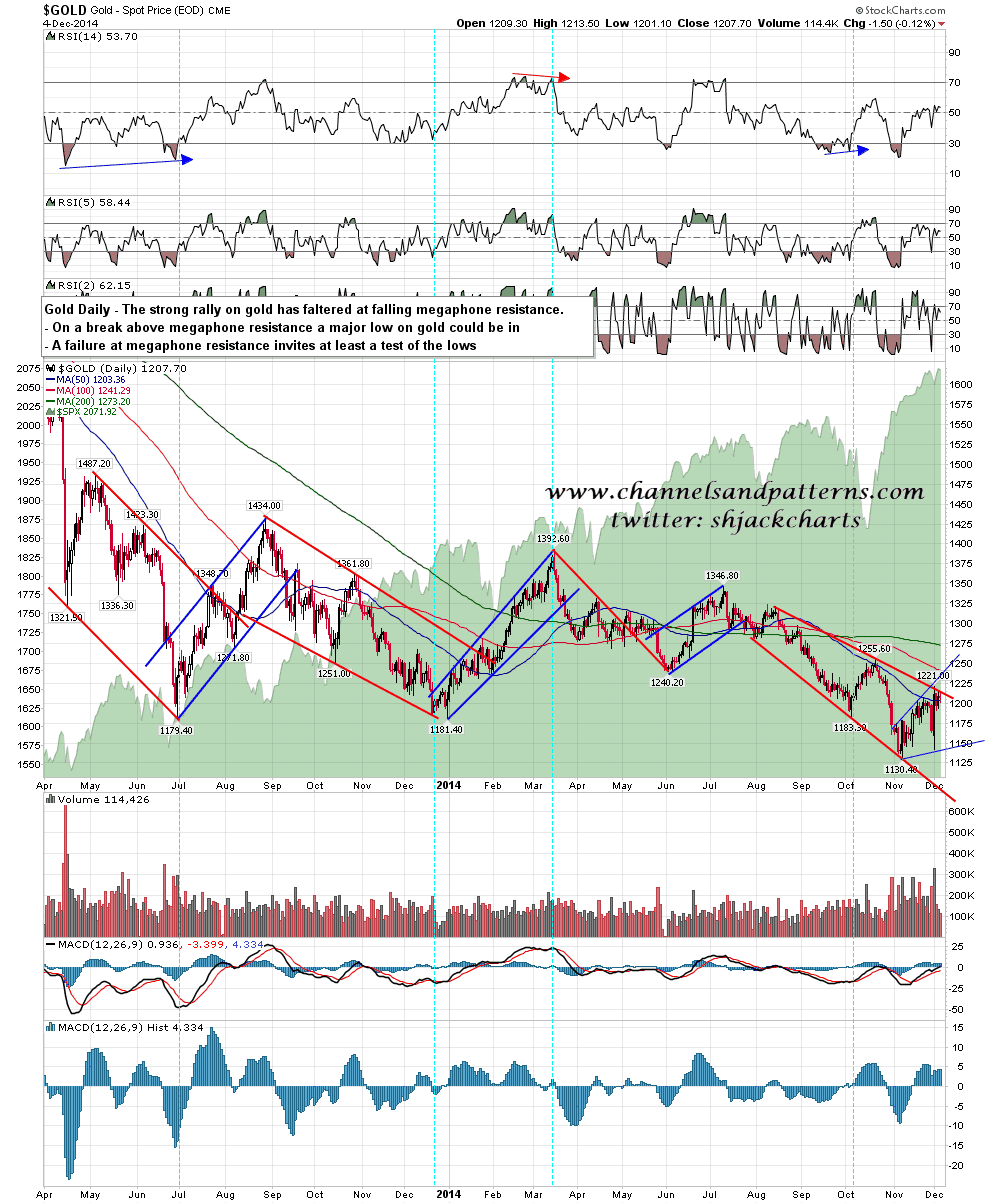
Are we seeing a significant low being made on gold and silver? Possibly, but the first real sign would be a break over falling megaphone resistance, and that”s holding so far. There is an almost identical setup on silver and if they break up that might well signal that the bear market on precious metals in ending. Gold daily chart:
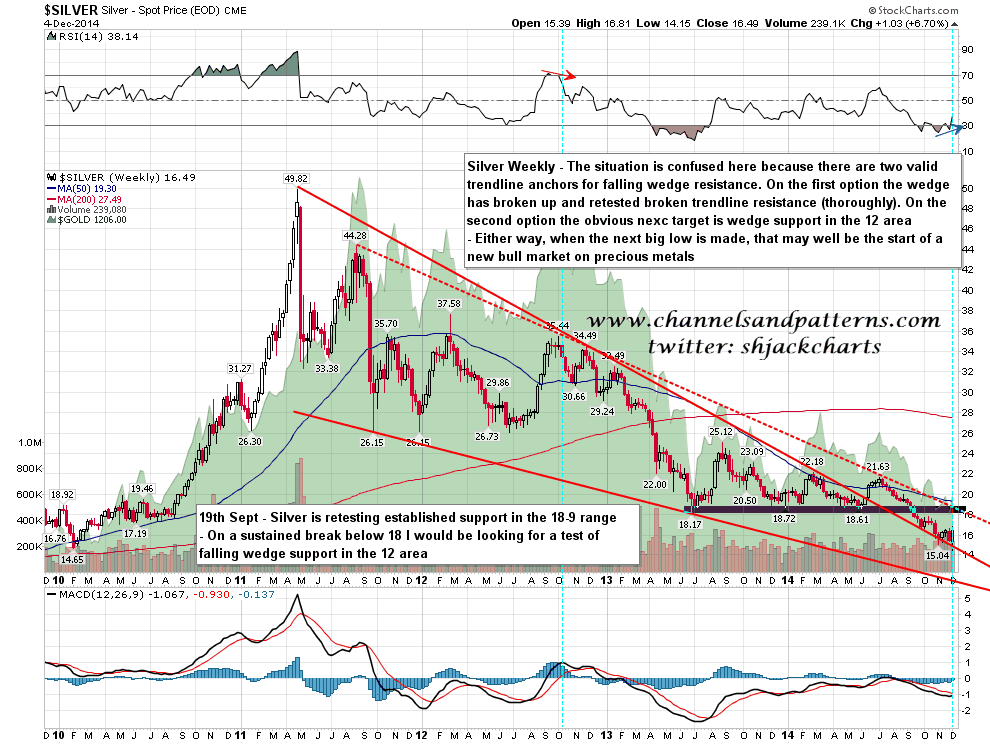
Why is that? Well it’s easiest to see on the main silver chart but it’s very possible looking at the chart below that the bear market low on silver has already been made. I’m watching this setup very carefully. Silver weekly chart:
The NFP numbers were a monster beat this morning, and the reaction so far has mainly been negative on SPX and very negative on bonds. Why? Well the odds of seeing QE4 anytime soon are reducing rapidly and the odds of seeing rising interest rates over the next few months are increasing. With low interest rates making equity dividends relatively more attractive, a move to a normal interest rate environment could obviously be bearish. I’m not seeing any particular reason to expect a break up today. If we are to see a break down then the 50 hour MA is now at 2067 and bulls need to break back below it and then (unlike yesterday) sustain that break.
