
The E-mini S&P500 (ESH15) is rising at the moment of writing this post (overnight): it has already reached levels that could start to be good for a DAILY SHORT trade (short term). The next shortable level would be 2047.75, if you scroll down after the chart you will hear more about our logic.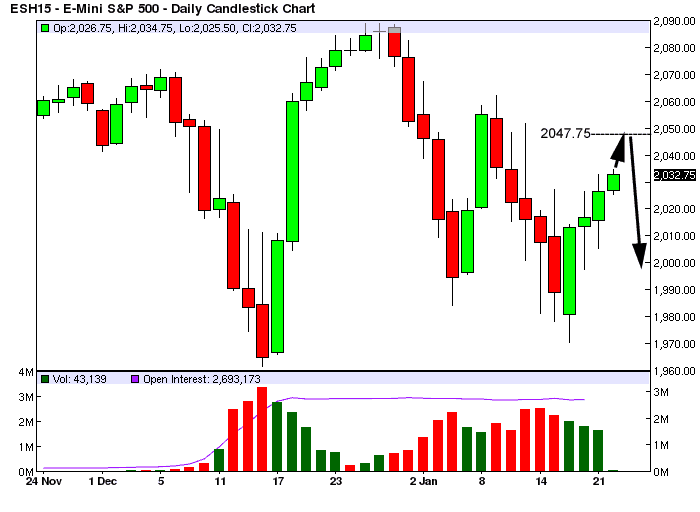 The DAILY vertical column on the table below shows a number of price levels rising in value from the bottom towards the top. These are basically retracement levels from the latest DAILY market lows in the ~1970 price area. Aside each level there is a value that is calculated with quantitative methods and express how much the market is OVERBOUGHT on a 0 to 100 scale (where 100 means: 99.99999% of the cases it won’t go higher than this level without making a pullback first).

How to read this table? Simple: the market is OVERBOUGHT when it reaches level that have a number on their side greater than 40.00. We have highlighted the 2047.75 level because the value there is 72.93, very overbought. As you can see 2025.50 had already a good value, 43.98, but between that level and 2047.75 the market will reach very overbought levels so a SHORT trade could work out well (this is a DAILY trade, so it’s a quick trade for a quick profit, this is not a trade suggesting to ride a BEAR MARKET from here, far from that).
If you are interested in receiving this type of analysis, LONG and SHORT, every day in your inbox, have a look at our E-mini S&P500 Analysis offer.
