
I’m felling better than I did yesterday. I should be fully recovered by Monday I think and normal service will resume.
SPX has made visual (near miss) hits of the daily upper band yesterday and today. SPX has also made a new all time high today and is at the first major resistance area to look for a possible hard fail. If there is a serious break up here then we would move up to the next big level of resistance. SPX daily chart:

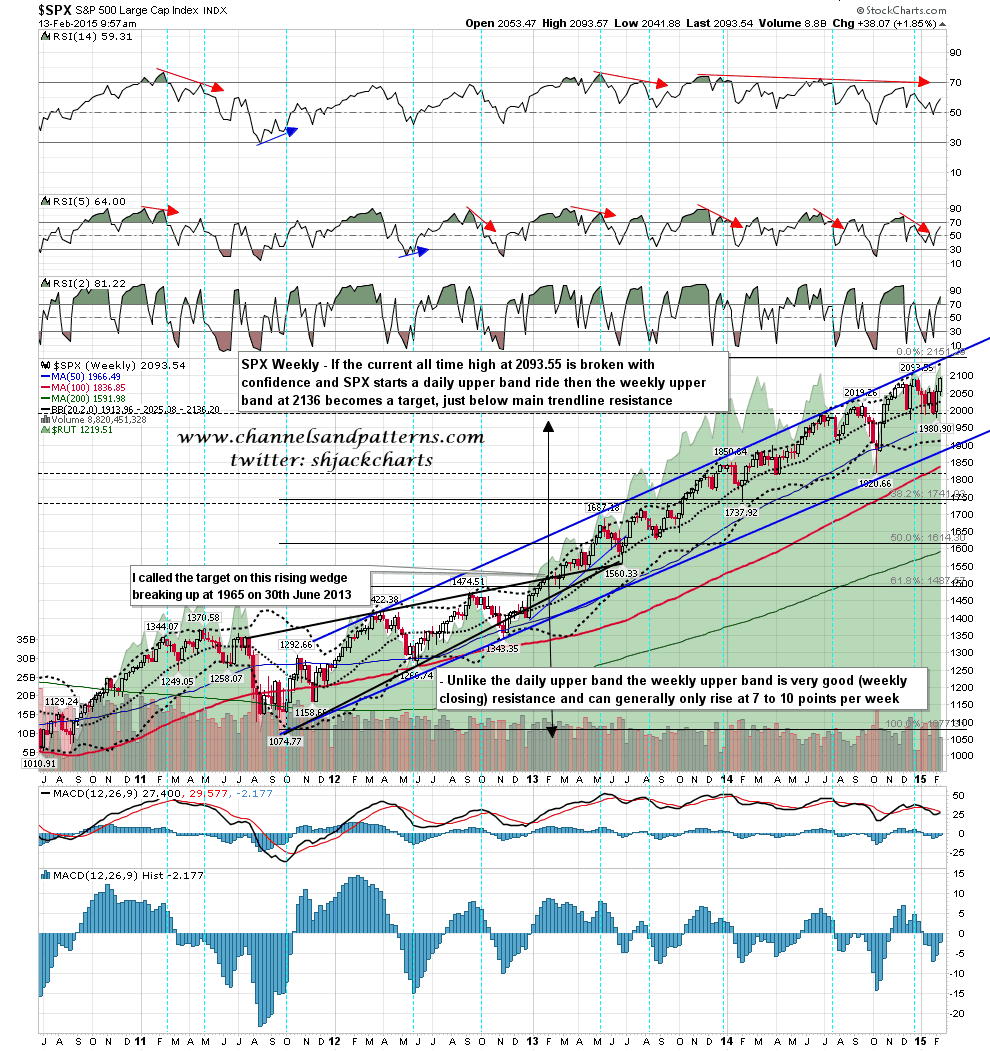
The next big level of resistance is on the weekly chart, at the weekly upper band, now at 2136 and just below main trendline resistance. If hit I would be expecting this area to hold and provide a very nice short entry. SPX weekly chart:
How will we tell if there is strong rejection at the current highs resistance area? The first very bearish sign would be a break below rising wedge or channel resistance, as that break would confirm this as a rising wedge, and open up wedge retracement targets in the 2051 (38.2% fib), 2038 (50% fib), and 2024 (61.8% fib) areas. If bears could then deliver a conviction break back below the daily middle band, now at 2044, then there would be a possible double top setup that would target the 1866 area on a break back below the last low at 1980.90. That would be a decent match with my main rising support trendline from the 2011 low so I’m watching this resistance test with great interest. SPX 15min chart:
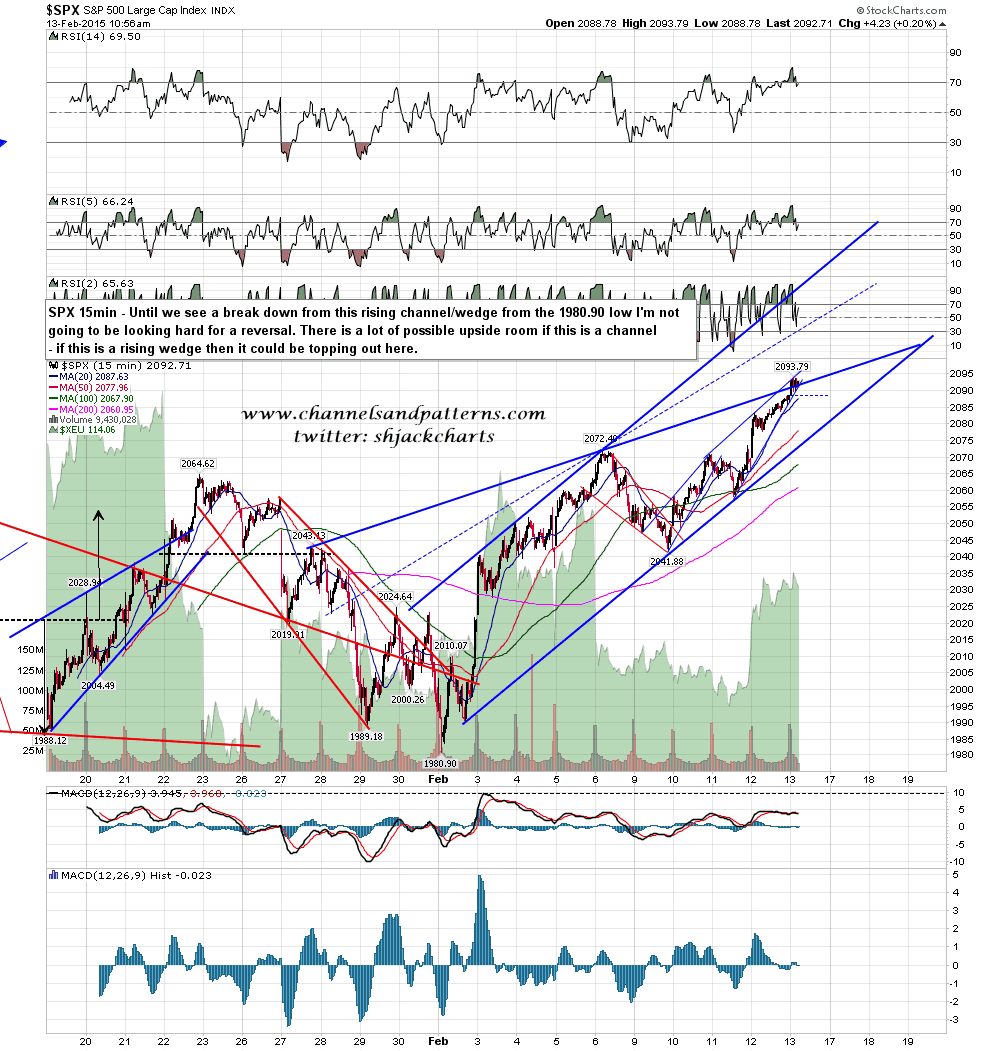
I’m not going to get particularly excited by the short side here until we see a break below rising wedge/channel support, now in the 2075-80 area. Everyone have a great weekend.
