
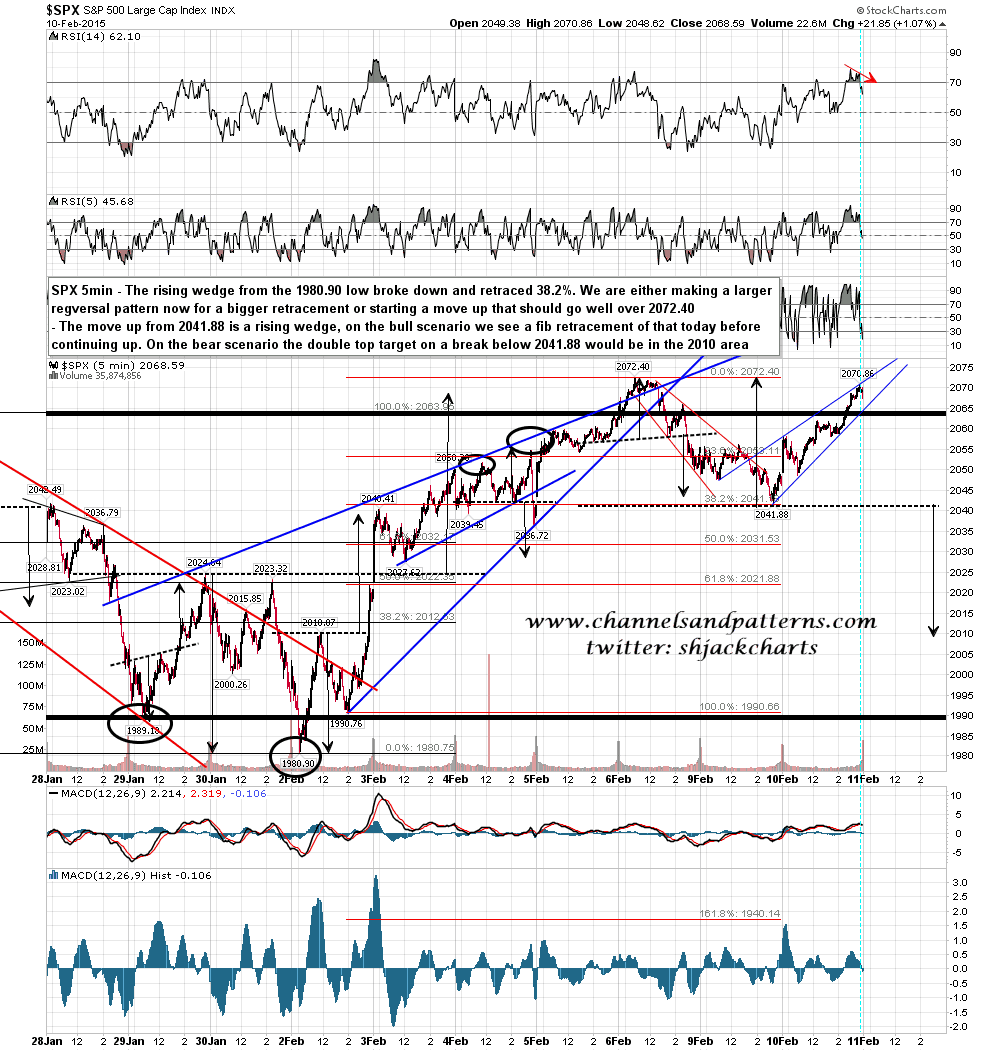
SPX regularly has runs where patterns repeat and we have a series here at the moment, with a bearish rising wedge from the October low that retraced 38%, into a bearish rising wedge from 1980 that retraced 38%, into a bearish rising wedge from Monday’s low at 2042. Will we see a 38% retrace of that wedge this morning? We shall see. 🙂
On the daily chart yesterday’s close was the first close outside the marked trading range in 2015. If bulls can turn that broken range resistance into support then I would expect to see a test of the all time high within days. SPX daily chart:

The move up from the 38.2% retrace of the medium sized wedge is, as with the move up from the 38.2% retrace of the large wedge above, either making the second high of a double top or starting a move higher. The key is Monday’s low at 2041.88. on a break below that this setup is either a double top or a bull flag, and on a sustained break the double top target would be in the 2010 area. SPX 5min chart:
The small rising wedge is the move up from Monday’s low. That overthrew bearishly at the high yesterday and has pinocchioed the wedge support trendline at the open today. On a sustained break down from wedge support I would be looking (on the bull scenario) for a fib retracement into one of the main fib retrace targets in the 2060, 20-56.5 or 2053 areas. On the bear scenario we would now see a full retracement back to retest Monday’s low at 2041.88. SPX 1min chart:
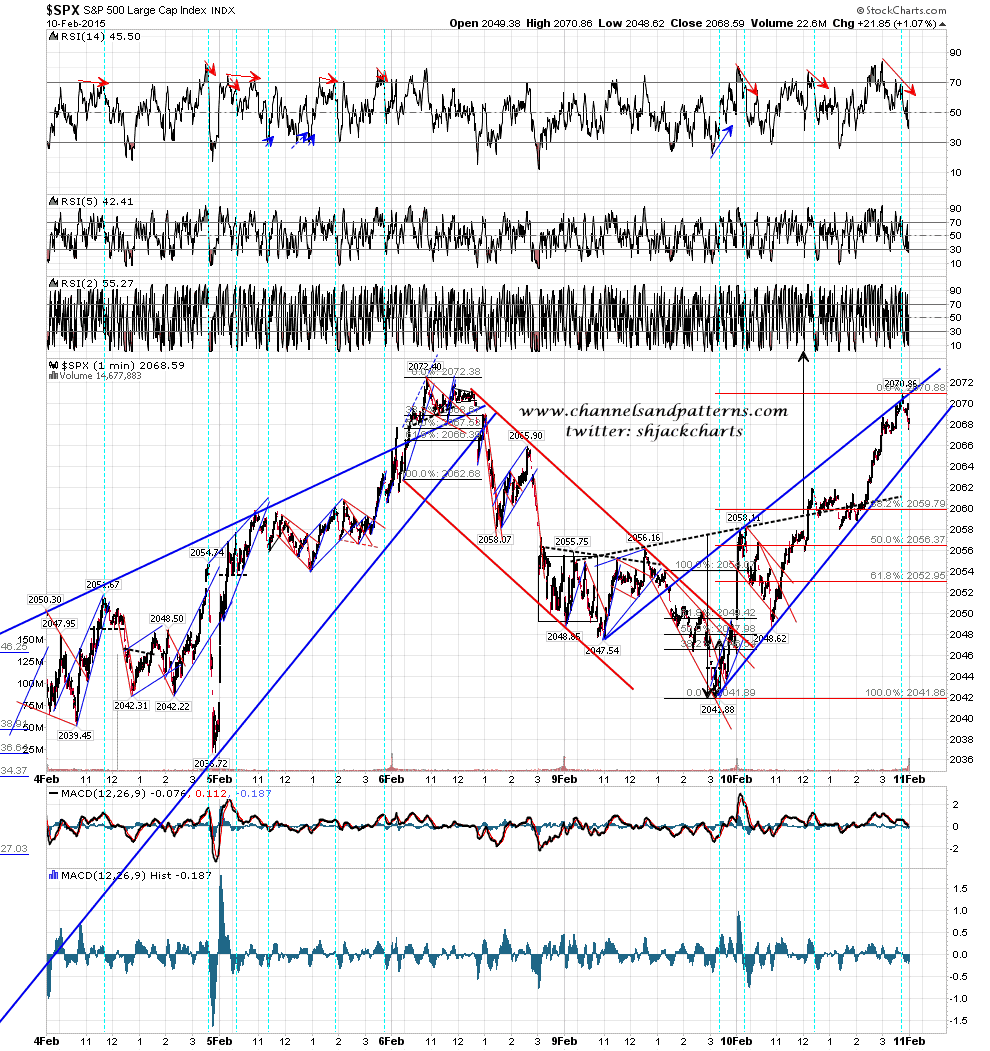
This could break either way here. I’ll be leaning long today after a fib retrace of the small rising wedge unless we see a break below Monday’s low at 2041.88.
