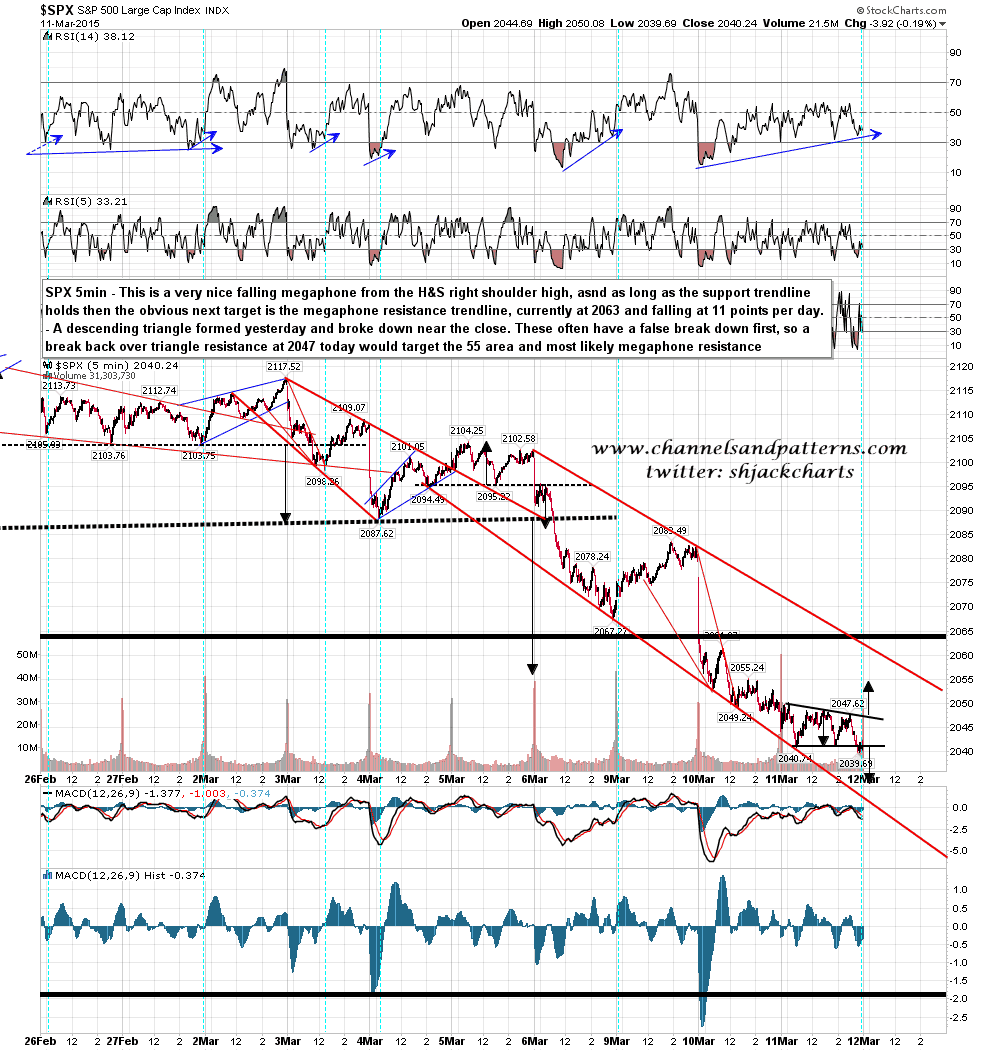
All of yesterday on the 5min chart was spent forming a descending triangle which broke down slightly near the close. There are often false breaks on these and if we see a decent break over triangle resistance this morning then we should make the triangle target at 2055. Falling megaphone resistance is currently in the 2063 area and falling at about ten points per day. SPX 5min chart:
Slope of Hope Blog Posts
Slope initially began as a blog, so this is where most of the website’s content resides. Here we have tens of thousands of posts dating back over a decade. These are listed in reverse chronological order. Click on any category icon below to see posts tagged with that particular subject, or click on a word in the category cloud on the right side of the screen for more specific choices.
Oil Breaks Triangle Base
Oil broke below support today but managed to close back above it. Key support for oil is at 48.46. What makes this level important is that it is the base of the descending triangle that has formed. It is make or break time for this pattern, as oil nears the sweet spot of this pattern. The key levels to watch now are the 50.15 level and the 48.46 level. A break above 50.15 voids this pattern. While a break below 48.46 and more importantly a close below it, confirms that pattern. The descending triangle provides a potential move of about -10% if it was to break. This would send oil down $44. Keep an eye out because if Oil sells off it just might be that catalyst that gets this market to sell off further. This pattern is also seen in USO. (Click on either chart for larger version): (more…)
Some Bearish Targets
I’m still very much positioned for further market weakness, and I’m hoping to hang on tight until the VIX gets back up to about 23 or so. Below are a few targets that I think would be reasonable in the face of a sell-off. First, the Dow: I’m looking for support just above 17,000:


