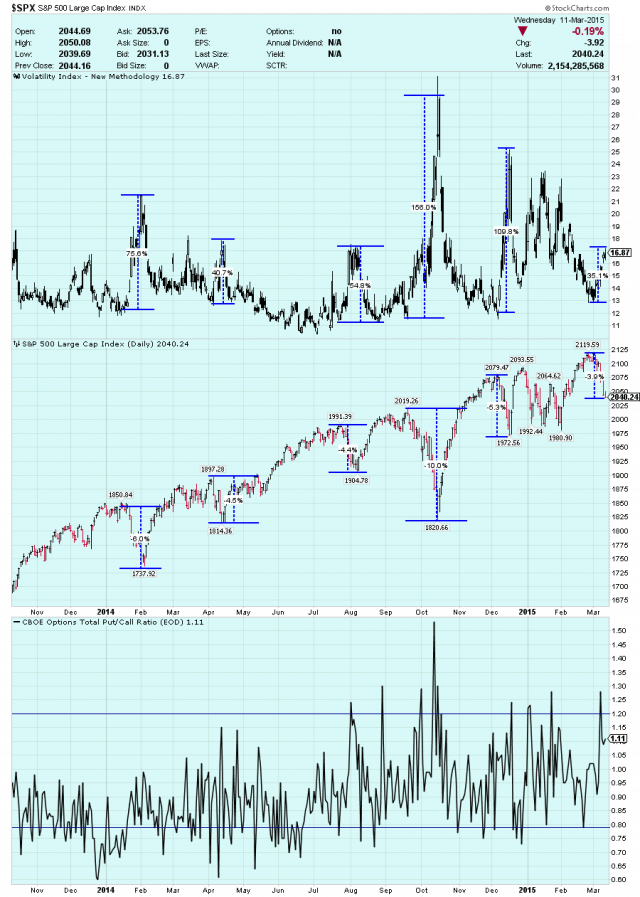
The market has fallen a little over 3% since it hit its highs and in the new bull fed supported market this is considered a crash, there is an overall lack of fear this decline compared to the last declines. Looking at the chart below you can see that the VIX index rallied at least 40% before the market bottoms. The stepper the decline the larger the drop but on average the VIX climbed 86%. So where are we now. Well the market has declined around 3.9% and the VIX has climbed about 35%. So what does this all mean, well it means there is a strong possibility that the market has another 2-3% decline and the VIX has another 5%-10% rally before we can start thinking a bottom has been put in. Of course the markets can prove us wrong but history does repeat its self. Click the chart to zoom in.
Here is a longer-term view of the same trend.

For more post check out Piker Trader


