Slope of Hope Blog Posts

Slope initially began as a blog, so this is where most of the website’s content resides. Here we have tens of thousands of posts dating back over a decade. These are listed in reverse chronological order. Click on any category icon below to see posts tagged with that particular subject, or click on a word in the category cloud on the right side of the screen for more specific choices.

All Shook Up

By -

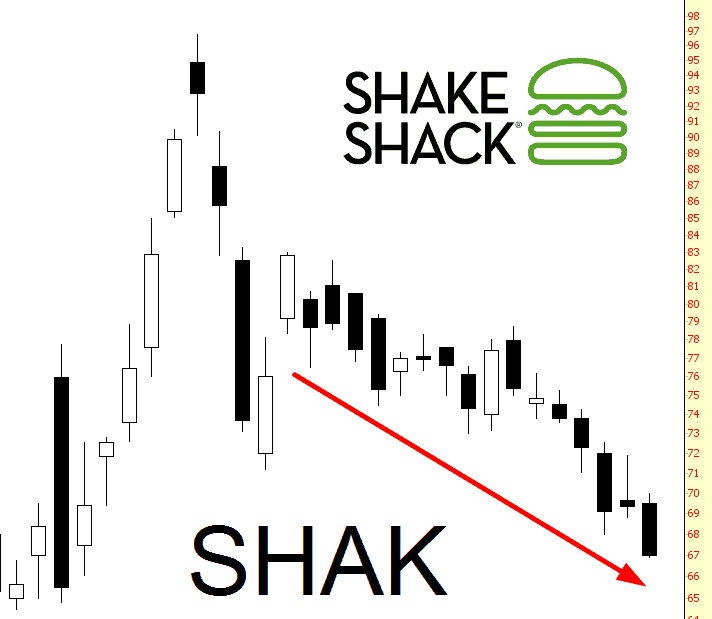
Here’s another fine example of how IPO mania can drive a stock up to prices that have simply no basis in reality: Shake Shack exploded to nearly $100 per share after its IPO. Since then, it’s lost about a third of its value. Remember, this is in the context of a market at lifetime highs. You don’t have to imagine very hard what sell-side analysis were saying to customers as the stock approaching triple digits. Hint: it wasn’t “sell here.”

0622-SHAKE

Fibonacci Resistance Levels on S&P 500 E-mini Futures

By -

Depicted on the Weekly chart below of the S&P 500 E-mini Futures Index (ES), are two External Fibonacci Retracements, a Fibonacci Extension, and a channel.

There are two upcoming levels of confluence representing major resistance:

  • the first is between 2139 and 2155 (which could be hit any day now)
  • the second is between 2213 and 2216 (which could be hit around July 20th if this extreme bull run continues in an aggressive, sustained momentum)

I’d watch for any aggressive drop below 2070 to signal a possible re-test of the bottom of the channel around the 1980 level, or even lower (I’d watch for general signs of weakness in the Dow Jones Composite Index — as noted in my post of June 20th — as confirmation)…otherwise, if price holds above 2070, we could very well see the second target resistance level hit by July 20th.